Active topology, pump curves, and a new suite of utilities
It’s been another big, busy month working at epanet-js. We’ve been working across the board on three main features—Active Topology, Pump Curves, and Selections—to build up the fundamentals for some major capabilities coming next.
But we’ve also launched a range of interesting new utility tools. The standout is our new Fire Flow Analysis, which allows you to run thousands of simulations directly in your browser to instantly check your network’s capacity to supply fire flows.
We’ve overhauled our external utilities website to host these new tools, but that’s just one part of the story. Inside the core app, we’ve released features that allow you to manage complex network states, model pumps with greater precision, and select vast areas of your system in seconds.
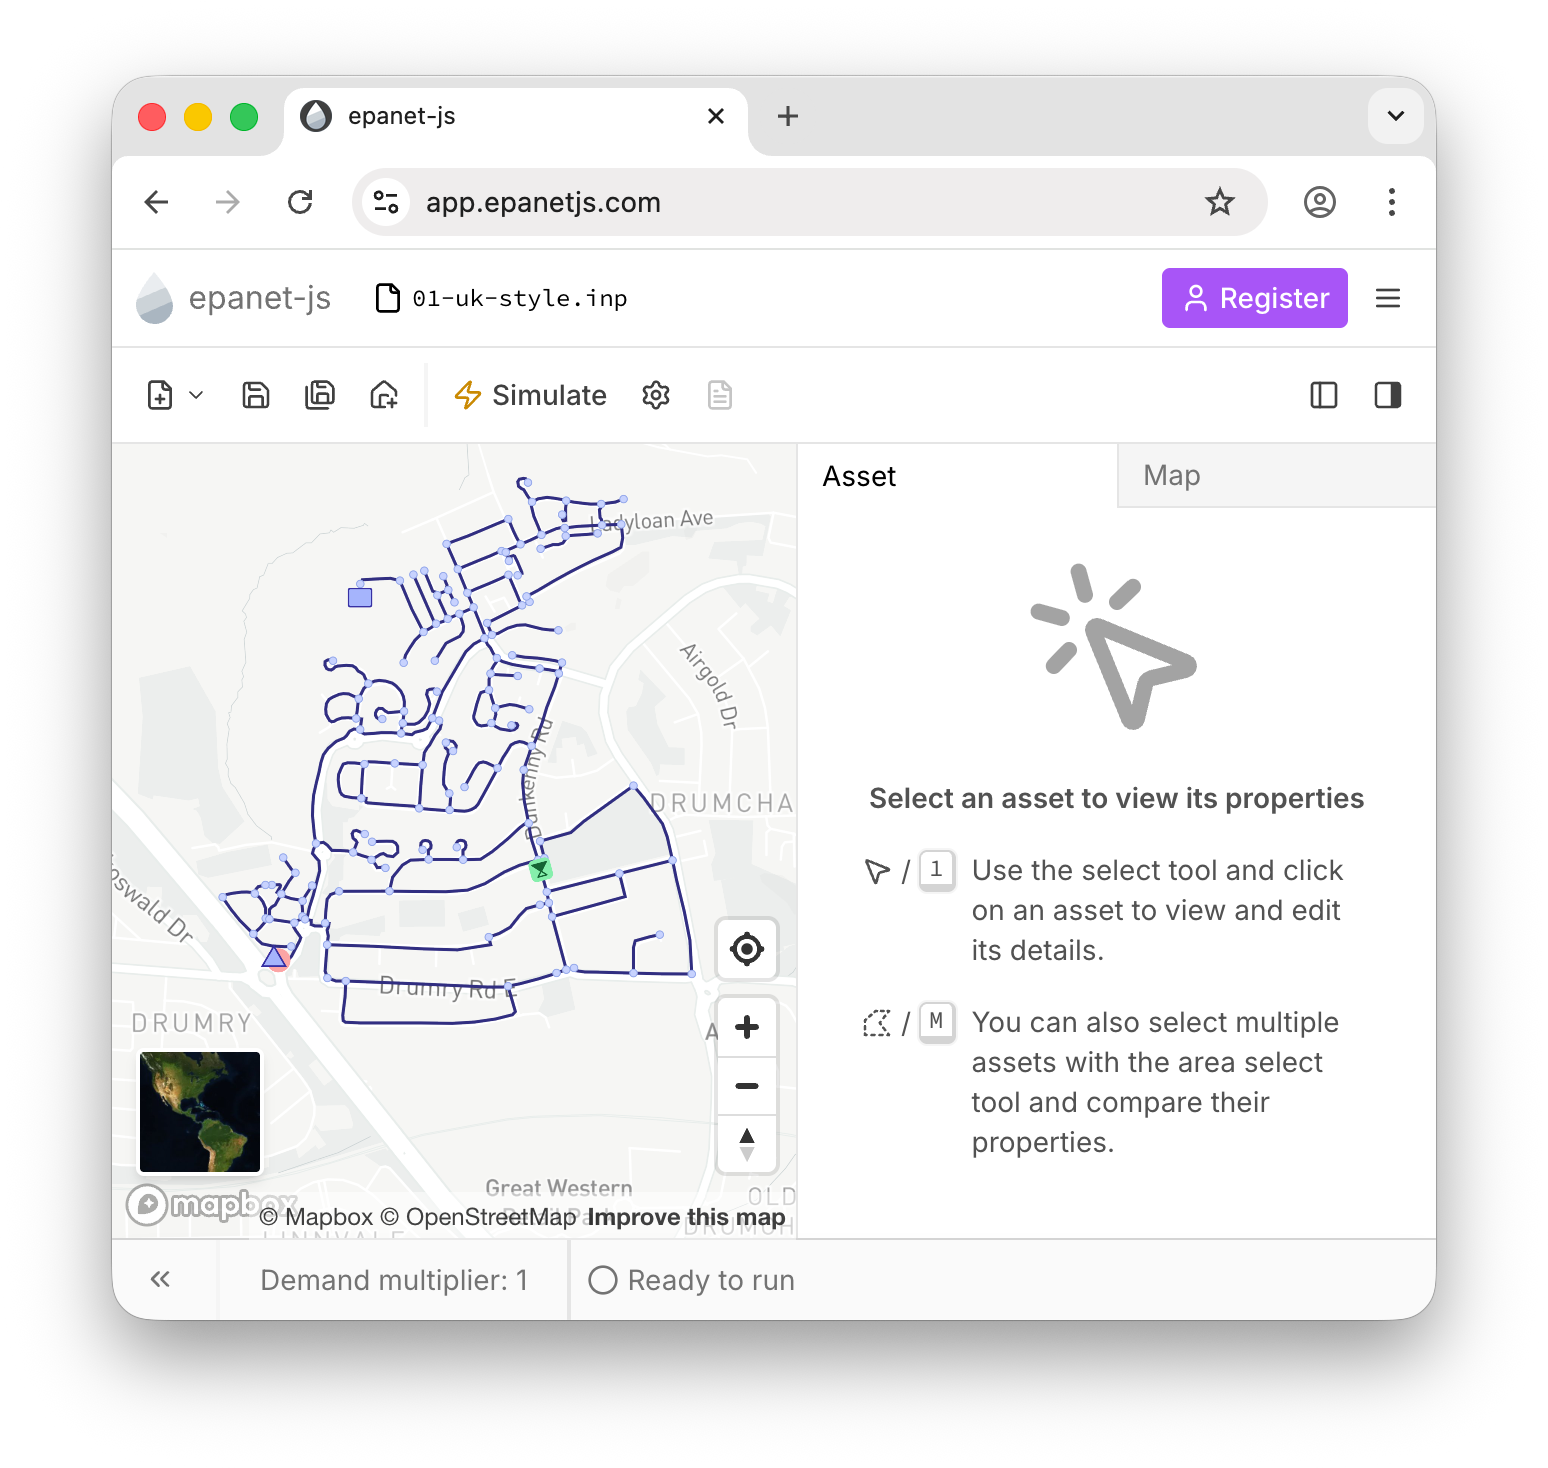
Active topology is here
You can now enable or disable links in your network, and those parts of the system will be excluded from the simulation. This lets you switch sections of your network on or off directly in the UI—no deleting assets, no copy-models, just clean control.
If you select an area and disable it, epanet-js automatically determines which connected junctions should also be excluded. That unlocks a whole new category of workflows:
- Growth planning: Enable new subdivisions as a city expands.
- Master planning: Test future layouts or staged upgrades.
- Alternative infrastructure: Compare tank locations or system expansions without rebuilding the model.
- Small-scale testing: Quickly toggle pump options or pipe alignments to see how they perform.
While active topology is already useful on its own, it’s also the foundation for something much bigger: Scenario Management. This is the core engine that will support complex, multi-year planning, alternative design pathways, and advanced modeling workflows—all within a single model.
Active topology moves epanet-js from simple simulations into true planning and scenario-based analysis.
Three-point pump curves
Defining pumps just got a lot clearer. We’ve added support for three-point curves, letting you define shutoff, design, and max operating values directly.
This is the first step in bringing epanet-js closer to full EPANET standard support. We’ve already planned the next phase: full user-defined pump curves. While the three-point curve offers great flexibility now, we are working toward giving you complete control to include custom curves to model any pump.
We also improved the one-point curve view. Now, instead of just entering design head and flow, the panel calculates and displays the shutoff head and maximum operating flow, giving you a better sense of the pump’s full operating range right in the attributes panel.
Polygonal selection tool
Selecting multiple assets is now much faster. We’ve added a new area selection tool that works exactly as you’d expect on a map:
- Draw a polygon around the assets you want to select.
- Hold Shift to add more areas (the polygon turns purple).
- Hold Alt to remove areas (the polygon turns orange).
This update is about more than just convenience; it’s a prerequisite for Multi-Element Editing. To edit many assets at once, you first need a fast, precise way to select them.
This is just the start of our new selection toolkit. We are planning to add Upstream and Downstream Tracing (selecting assets based on flow direction) and a Boundary Select tool, which will let you extend a selection out to user-defined hydraulic boundaries like closed valves or PRVs.
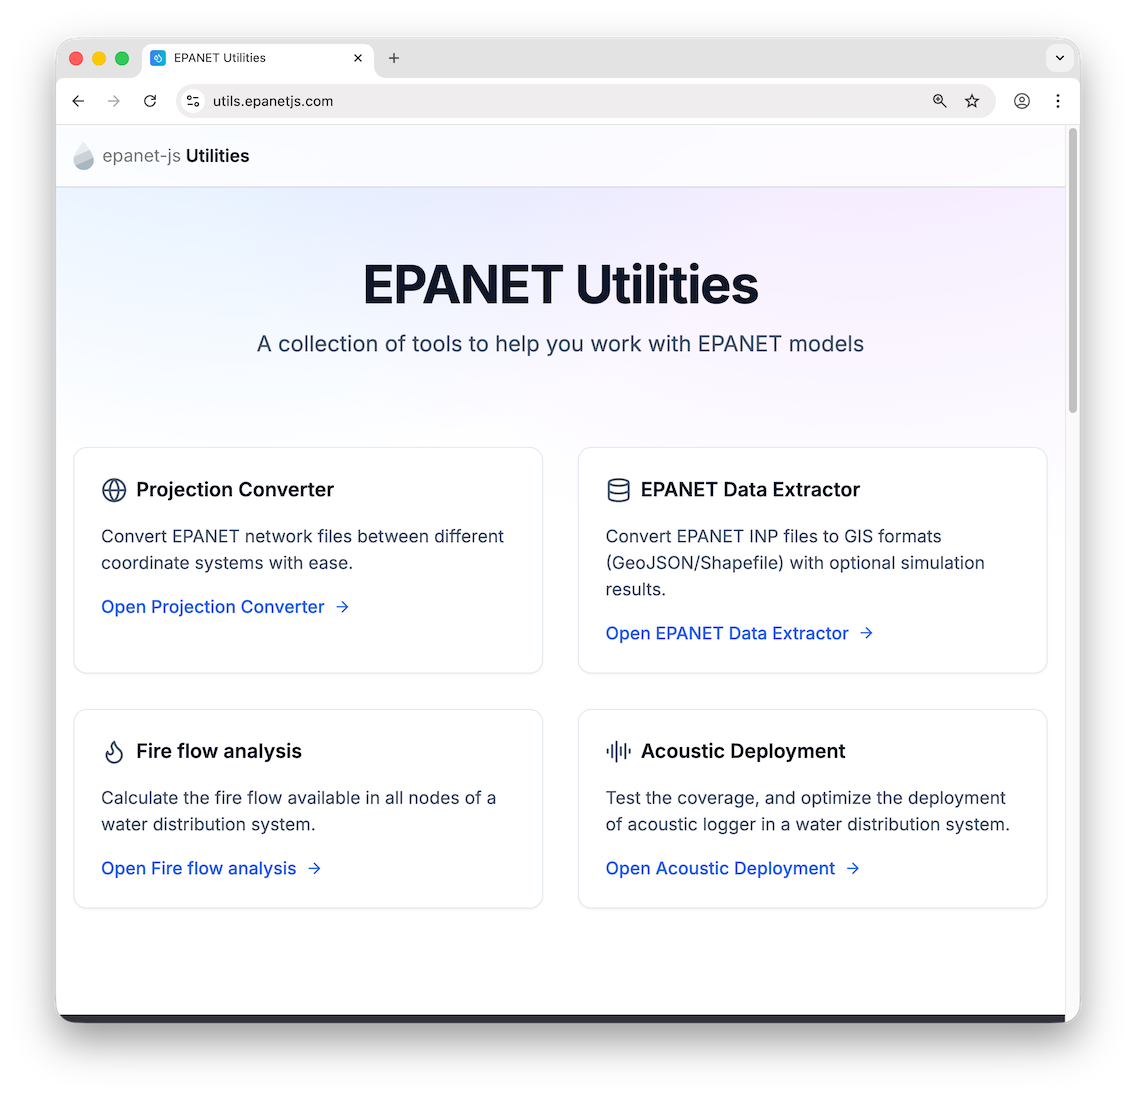
New apps on the utilities site
We’ve redesigned the epanet-js utilities website and launched three new standalone apps. These serve as proofs of concept—allowing us to get features into your hands quickly while we work on merging them into the core application.
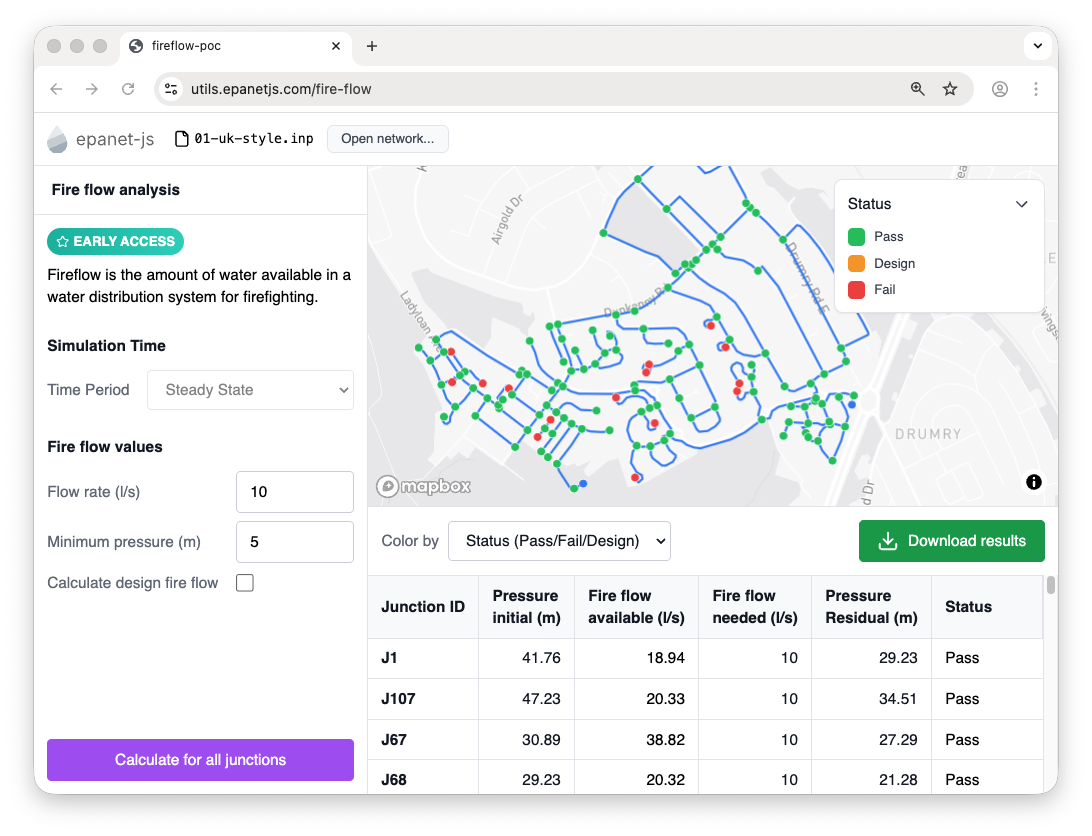
Fire flow analysis
You can now run full fire flow assessments directly in your browser. The tool runs a rapid series of simulations—processing hundreds of nodes per second—to calculate three key checks:
- Available fire flow: The maximum flow the network can supply at a location before pressure drops below your minimum limit.
- Needed fire flow: If your required flow is lower than what’s available, this reports the actual residual pressure at that design flow.
- Designed fire flow: The critical system-wide check that ensures pulling fire flow at one node doesn’t violate pressure or velocity constraints anywhere else in the network.
While this lives on the utilities site for now, the plan is to bring this capability directly into epanet-js so it becomes a native part of your analysis workflow.
We also published a YouTube video that walks through the entire process and explains each type of fire flow in detail.
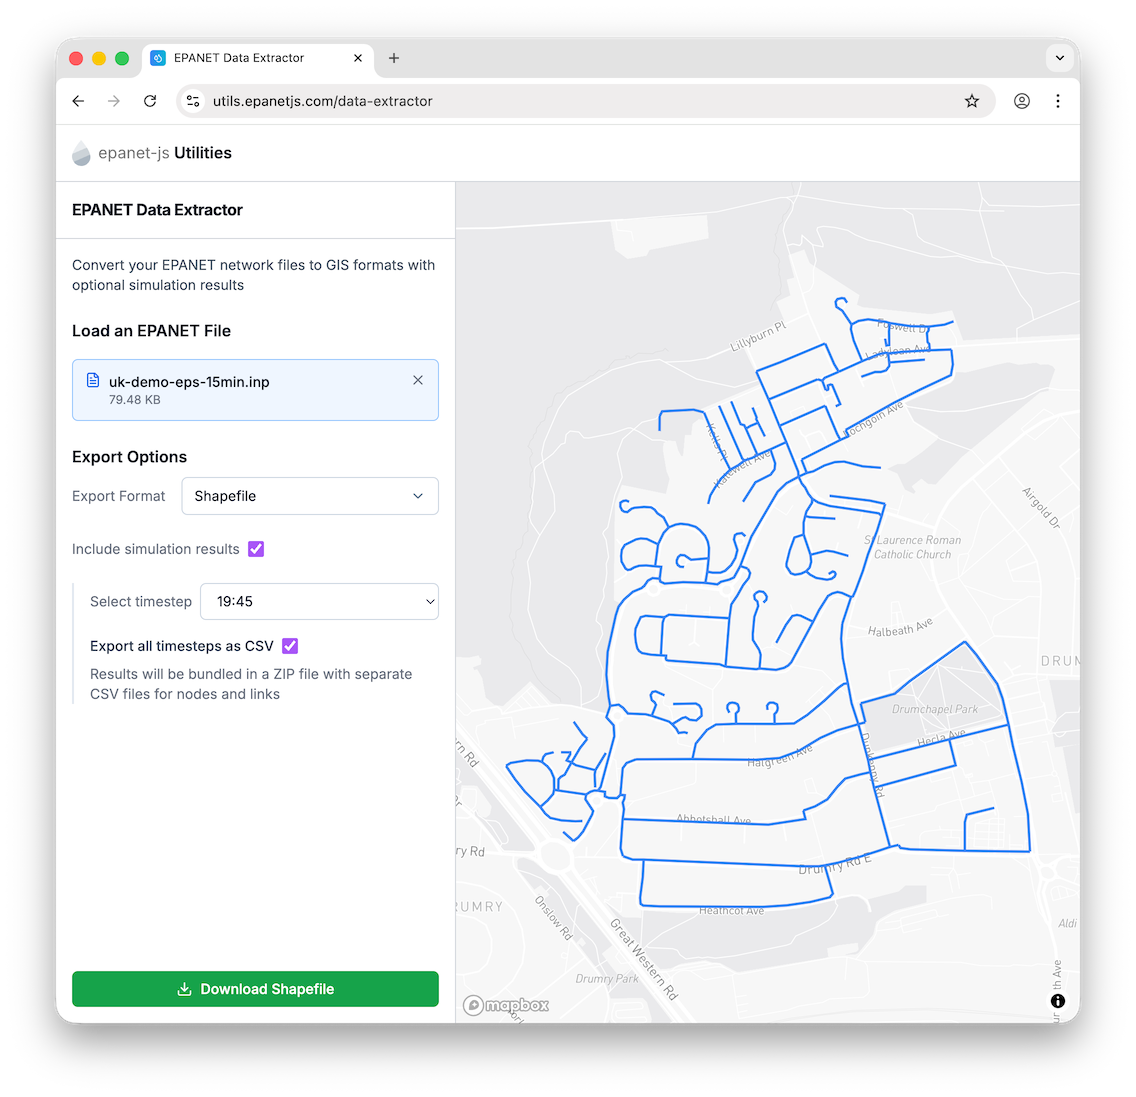
Data extractor
A simple but essential utility. Drop in an .inp file to extract GIS data (as GeoJSON or SHP) or get a full CSV extract of your simulation results. Like the Fire Flow tool, we plan to bring this functionality into the main app to make data export seamless.
Acoustic Logger Optimization
We’ve released a new tool for exploring acoustic logger placement, supporting both manual planning and automatic optimization. You can drop loggers onto the map to see their listening range instantly, giving you a clear visual of coverage and helping you test deployment ideas on the fly.
For more advanced analysis, the tool includes a genetic algorithm that searches thousands of combinations to find layouts that maximize coverage while minimizing cost. You can watch the solution improve live on the map as each generation updates.
Smoother workflows
We also shipped a collection of quality-of-life improvements to make the drawing and editing experience smoother.
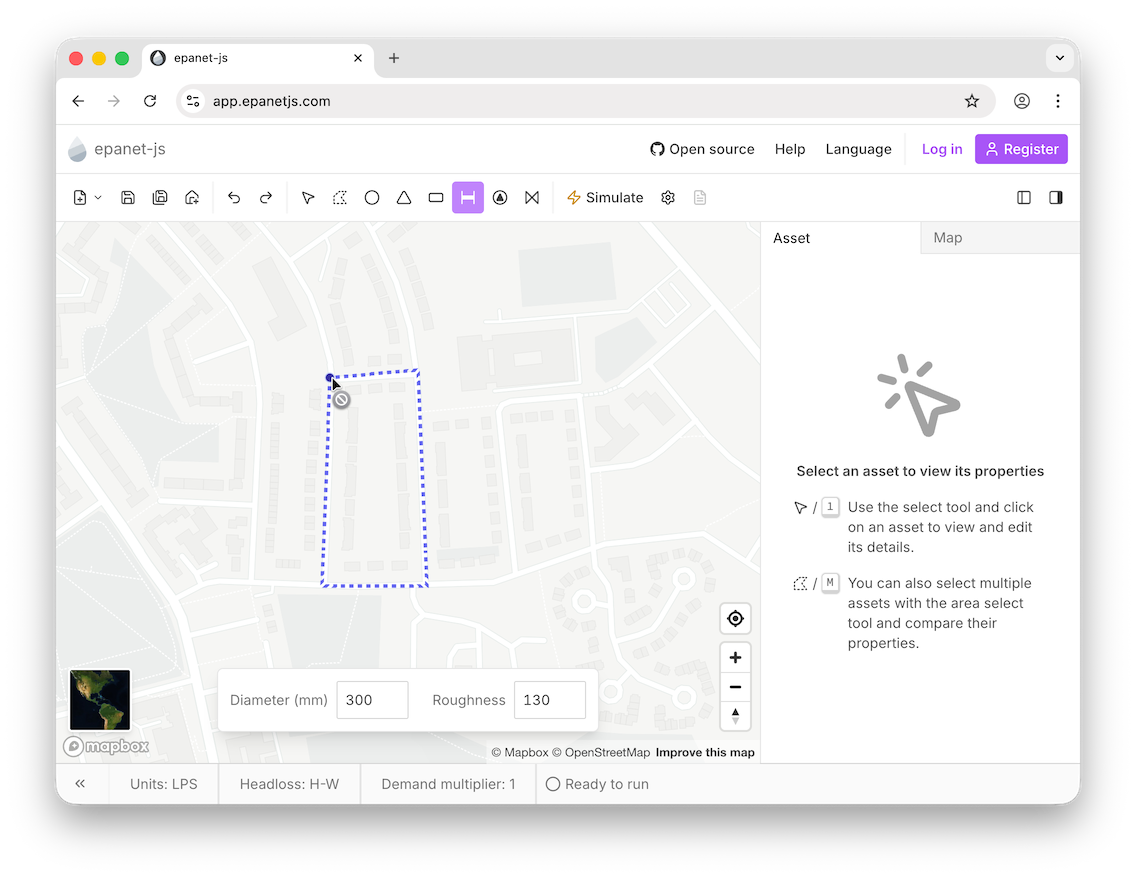
Customize pipe defaults
A new floating panel lets you set diameter and roughness before you start drawing, saving you from editing attributes for every single new pipe.
Auto-split pipes
When you draw a valve, pump, or pipe directly on top of an existing pipe, epanet-js now automatically splits the underlying pipe and connects everything correctly. No more duplicate parallel pipes!
Sticky headers
The action buttons in the asset panel are now sticky, so they remain visible even when you scroll down long lists of attributes.

Empty state
We’ve cleaned up the asset panel to show a helpful empty state when nothing is selected, removing the old tutorial text.
Loop detection
You’ll now see a cursor hint if you try to create a loop where a pipe starts and ends at the same node.
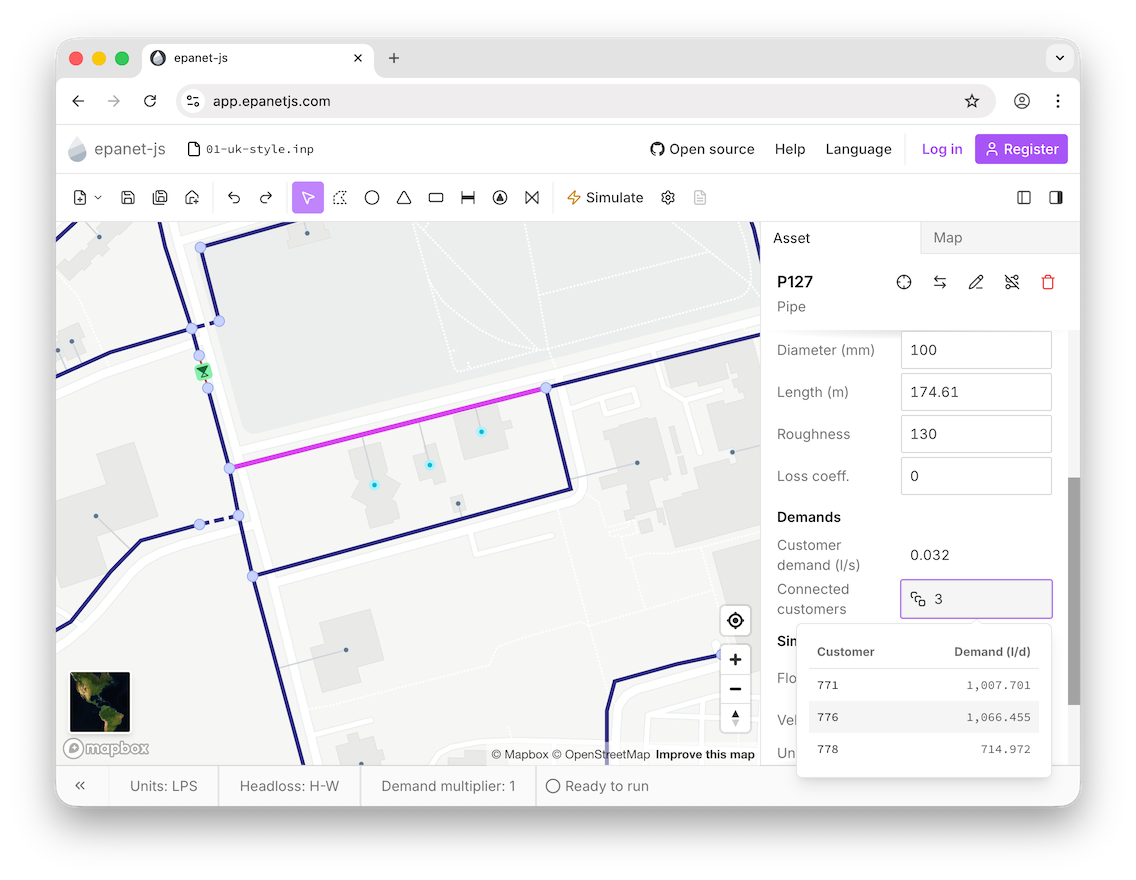
Customer points on pipes
You can now see the aggregated demand and list of specific customers directly on the Pipe asset, not just the Junction.
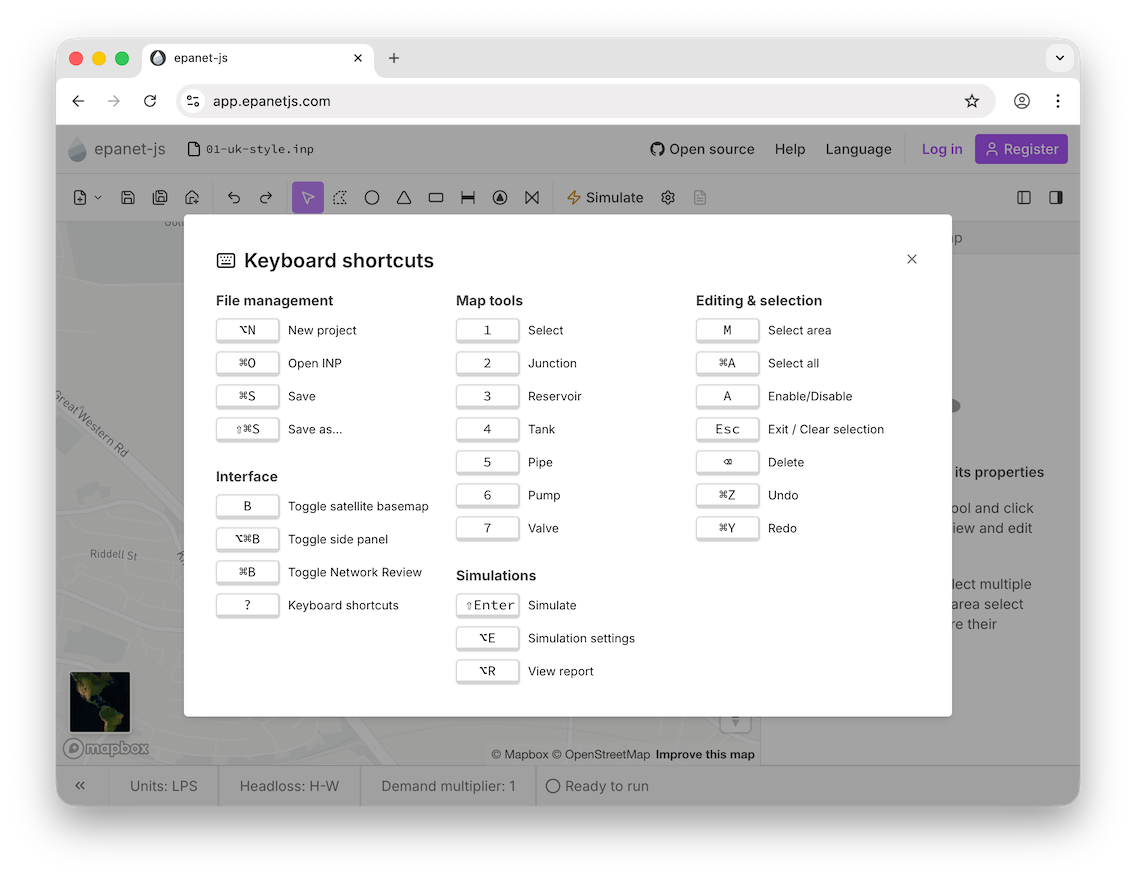
Better shortcuts
We’ve reorganized the Keyboard Shortcuts menu into logical groups so it’s easier to find what you need.
Community & events
IWA water loss webinar
Luke presented to the IWA Water Loss Specialist Group on using hydraulic models to reduce water loss. You can watch the recording below.
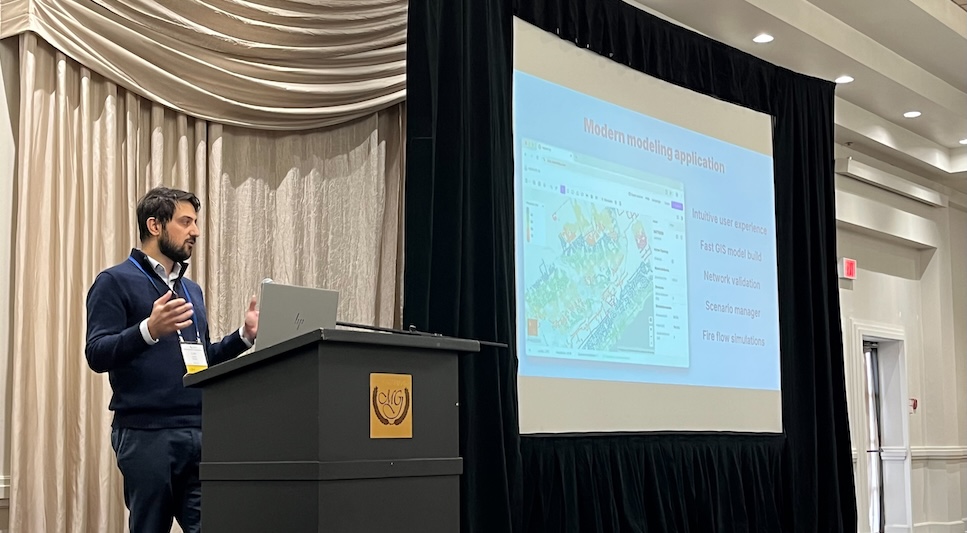
Conferences
The team attended the Suez and Optimatics user group in Portland, the CwMAG conference in the UK, and Luke presented at the WEAO Intelligent Water Solutions seminar in Ontario.
Join our hands-on webinar in January
We are hosting a special hands-on webinar in January. We will provide a real GIS dataset, and together we will walk through the entire process of building a model, getting it running, and performing a fire flow test live. It’s the perfect way to learn the workflow.
From GIS to running model: a hands-on hydraulic modeling workshop - register now!
powered by CrowdcastWhat’s next
We recently polled the community on LinkedIn to ask what you wanted next: Scenario Management or Extended Period Simulations (EPS).
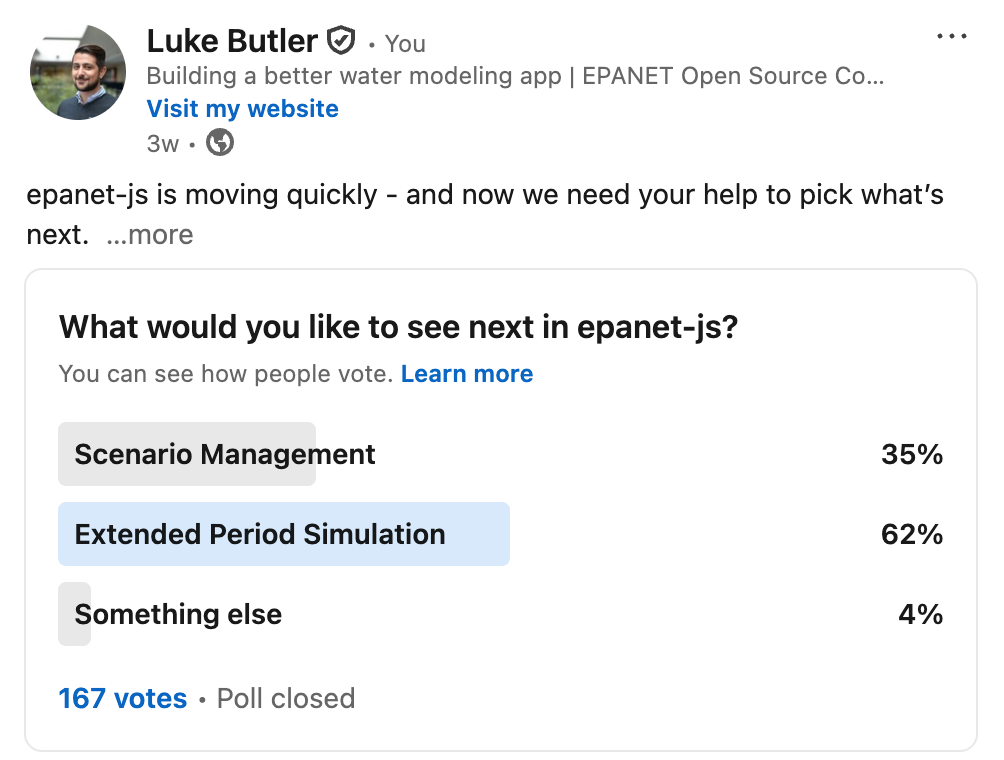
While Active Topology laid the foundation for scenarios, the vote was clear—you want EPS first. We’re listening.
In December, our primary focus is making Extended Period Simulations work correctly in epanet-js. We’re putting scenarios on hold for the new year to open up the tool for the widest possible range of users right now.
Support EPANET by using software that supports it back.
— Luke and Sam