Projections, custom elevations, and a new pricing model
March was another big month for us. We’ve delivered a set of features that fundamentally change how you get your model onto a map — and how you work with elevation data once it’s there.
You can now project your network directly inside epanet-js, load your own high-resolution elevation data from GeoTIFF files, and manage customer points without needing a bulk import. We’ve also added new simulation capabilities from EPANET 2.3, including pressure unit selection and pump energy reporting.
And in a move we’re proud of — we’ve significantly reduced the price of our Teams plan.
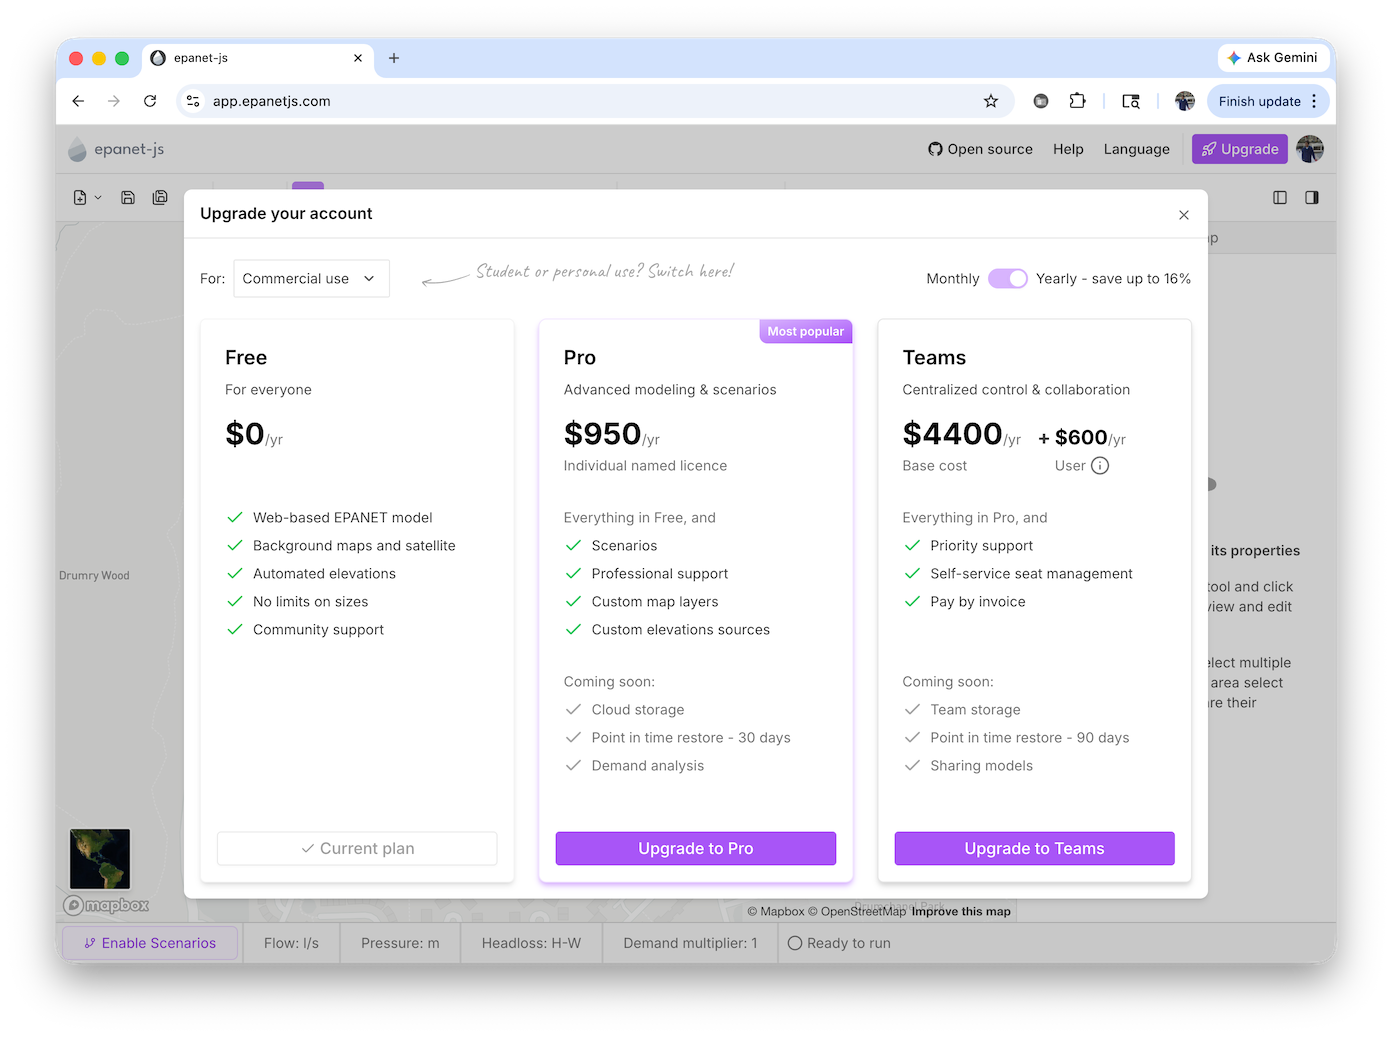
Teams plan: a new pricing model
We’ve done something unheard of in hydraulic modeling software — we’ve reduced our price.
We believe pricing shouldn’t be the barrier to using high-quality hydraulic modelling tools. So we’ve moved from $2,500 per user/year to a new model: $600 per user/year + $4,400 fixed cost
For most teams, this means a significant reduction — often more than half. For example, a team of five drops from $12,500/year to $7,400/year.
Our goal at Iterating is simple: make epanet-js accessible, fairly priced, and sustainable, so more engineers, utilities, and teams can build, maintain, and understand their networks without being limited by cost. If we want better tools in this space, they need to be usable by more people.
And of course, there’s still the free version, which already supports thousands of users who don’t need professional support or advanced features. No catch, no trick — just great open-source and sustainable hydraulic modelling software.
Project your network directly in epanet-js
One of the biggest hurdles when working with EPANET models has been getting your network onto a map. Previously, you had to convert your coordinates to latitude and longitude using an external tool before your model would display on the basemap. That’s no longer needed.
You can now load an INP file and project it directly inside epanet-js. When you open a file, a modal appears with a map on the right and a search box on the left. You have two ways to find your projection:
- Search by location: Type an address or city name, and epanet-js will navigate to that area and list the potential projection systems for that region. Select one, and your network is placed on the map. You can click through the options to confirm the projection looks correct.
- Search by projection: If you already know your coordinate system, type the EPSG code or the projection name (e.g., “British National Grid”) directly into the search box. You can freely switch between searching for locations and searching for projections.
Your model stays in its original coordinate system — no conversion required. This is a major step toward making it as easy as possible to get your model up and running and understand where your assets sit in the real world.
Custom elevation sources
You can now manage your own elevation data in epanet-js by loading GeoTIFF files directly into the app. This allows you to use high-resolution local elevation data when setting node elevations in your hydraulic models — rather than relying solely on the default global source.
In the Map panel, under the Elevations section, click Add new elevation data to load a GeoTIFF. There is no practical file size limit — we’ve tested with files over 10 GB. The app reads directly from your disk and only loads the parts it needs, so even very large datasets work without issue.
You can add multiple elevation sources and drag them into your preferred priority order, with highest-resolution data first and more general data below. Elevation lookups fall through the stack — if a point isn’t covered by the top layer, the next one is checked, and so on. You can also apply a vertical offset to any layer, and you can disable the default Mapbox source entirely using the visibility toggle.
When you load a dataset, you can click the grid icon to see all the individual files within it. Hovering over a file shows its bounding box on the map, and clicking it navigates to that area — making it easy to verify coverage.
Custom elevation sources are available on all paid plans — Pro, Teams, Education, and Personal.
Customer point management
Customer points represent the locations of demand within your system — typically service connections or meter locations. They connect into the network at a pipe and are associated downstream to junctions.
Previously, customer points had to be bulk imported from GIS data. You can now manage them directly in epanet-js:
- Add individually: Place customer points one at a time on the map.
- Edit properties: Update the demand, demand profiles, and IDs for any customer point.
- Reconnect: Reassign a customer point to a different pipe.
- Delete: Remove individual customer points as needed.
Simulation upgrades
Pressure unit selection
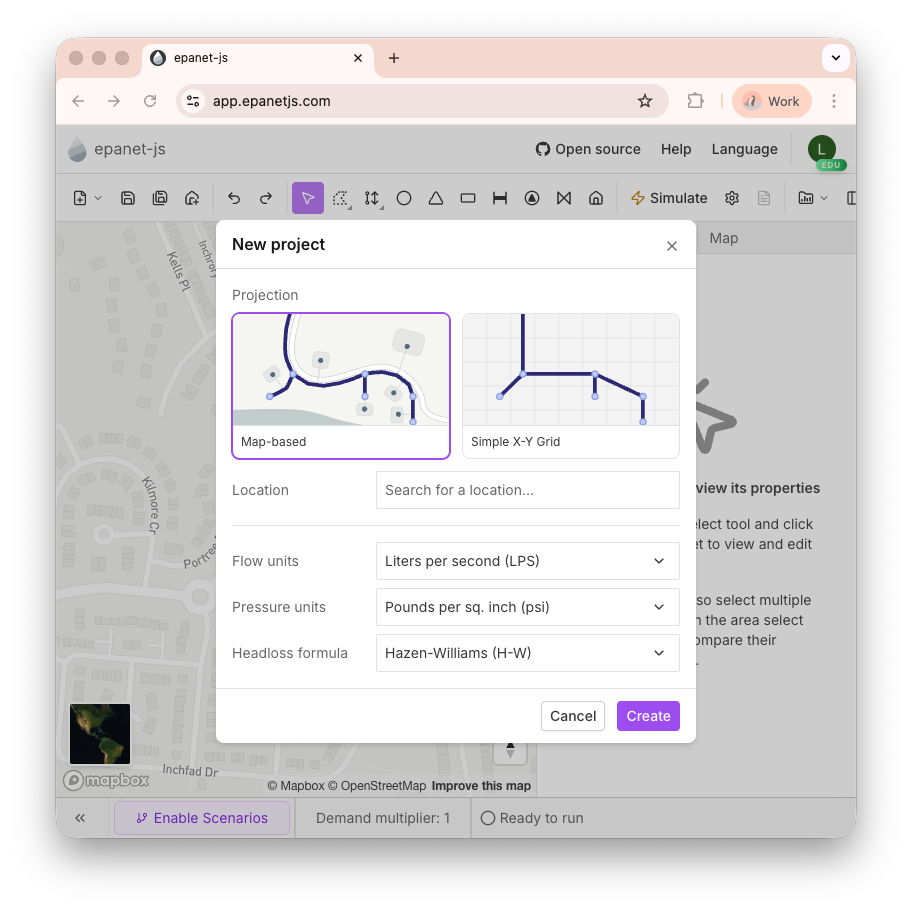
EPANET 2.3 introduced the ability to separate flow units and pressure units, and this is now supported in epanet-js. When you start a new project, you can choose your pressure units independently from your flow units.
This means you’re no longer restricted to a single unit system. You can, for example, run a model using gallons per minute for flow while reporting pressure in meters — a common setup in places like Canada where metric units are used for flows and pipe sizes but PSI is used for pressures.
Pressure can be set to any of the following: psi, kPa, meters, feet, or bar.
This capability was made possible by the EPANET 2.3 engine upgrade we shipped in February.
Pump energy reporting
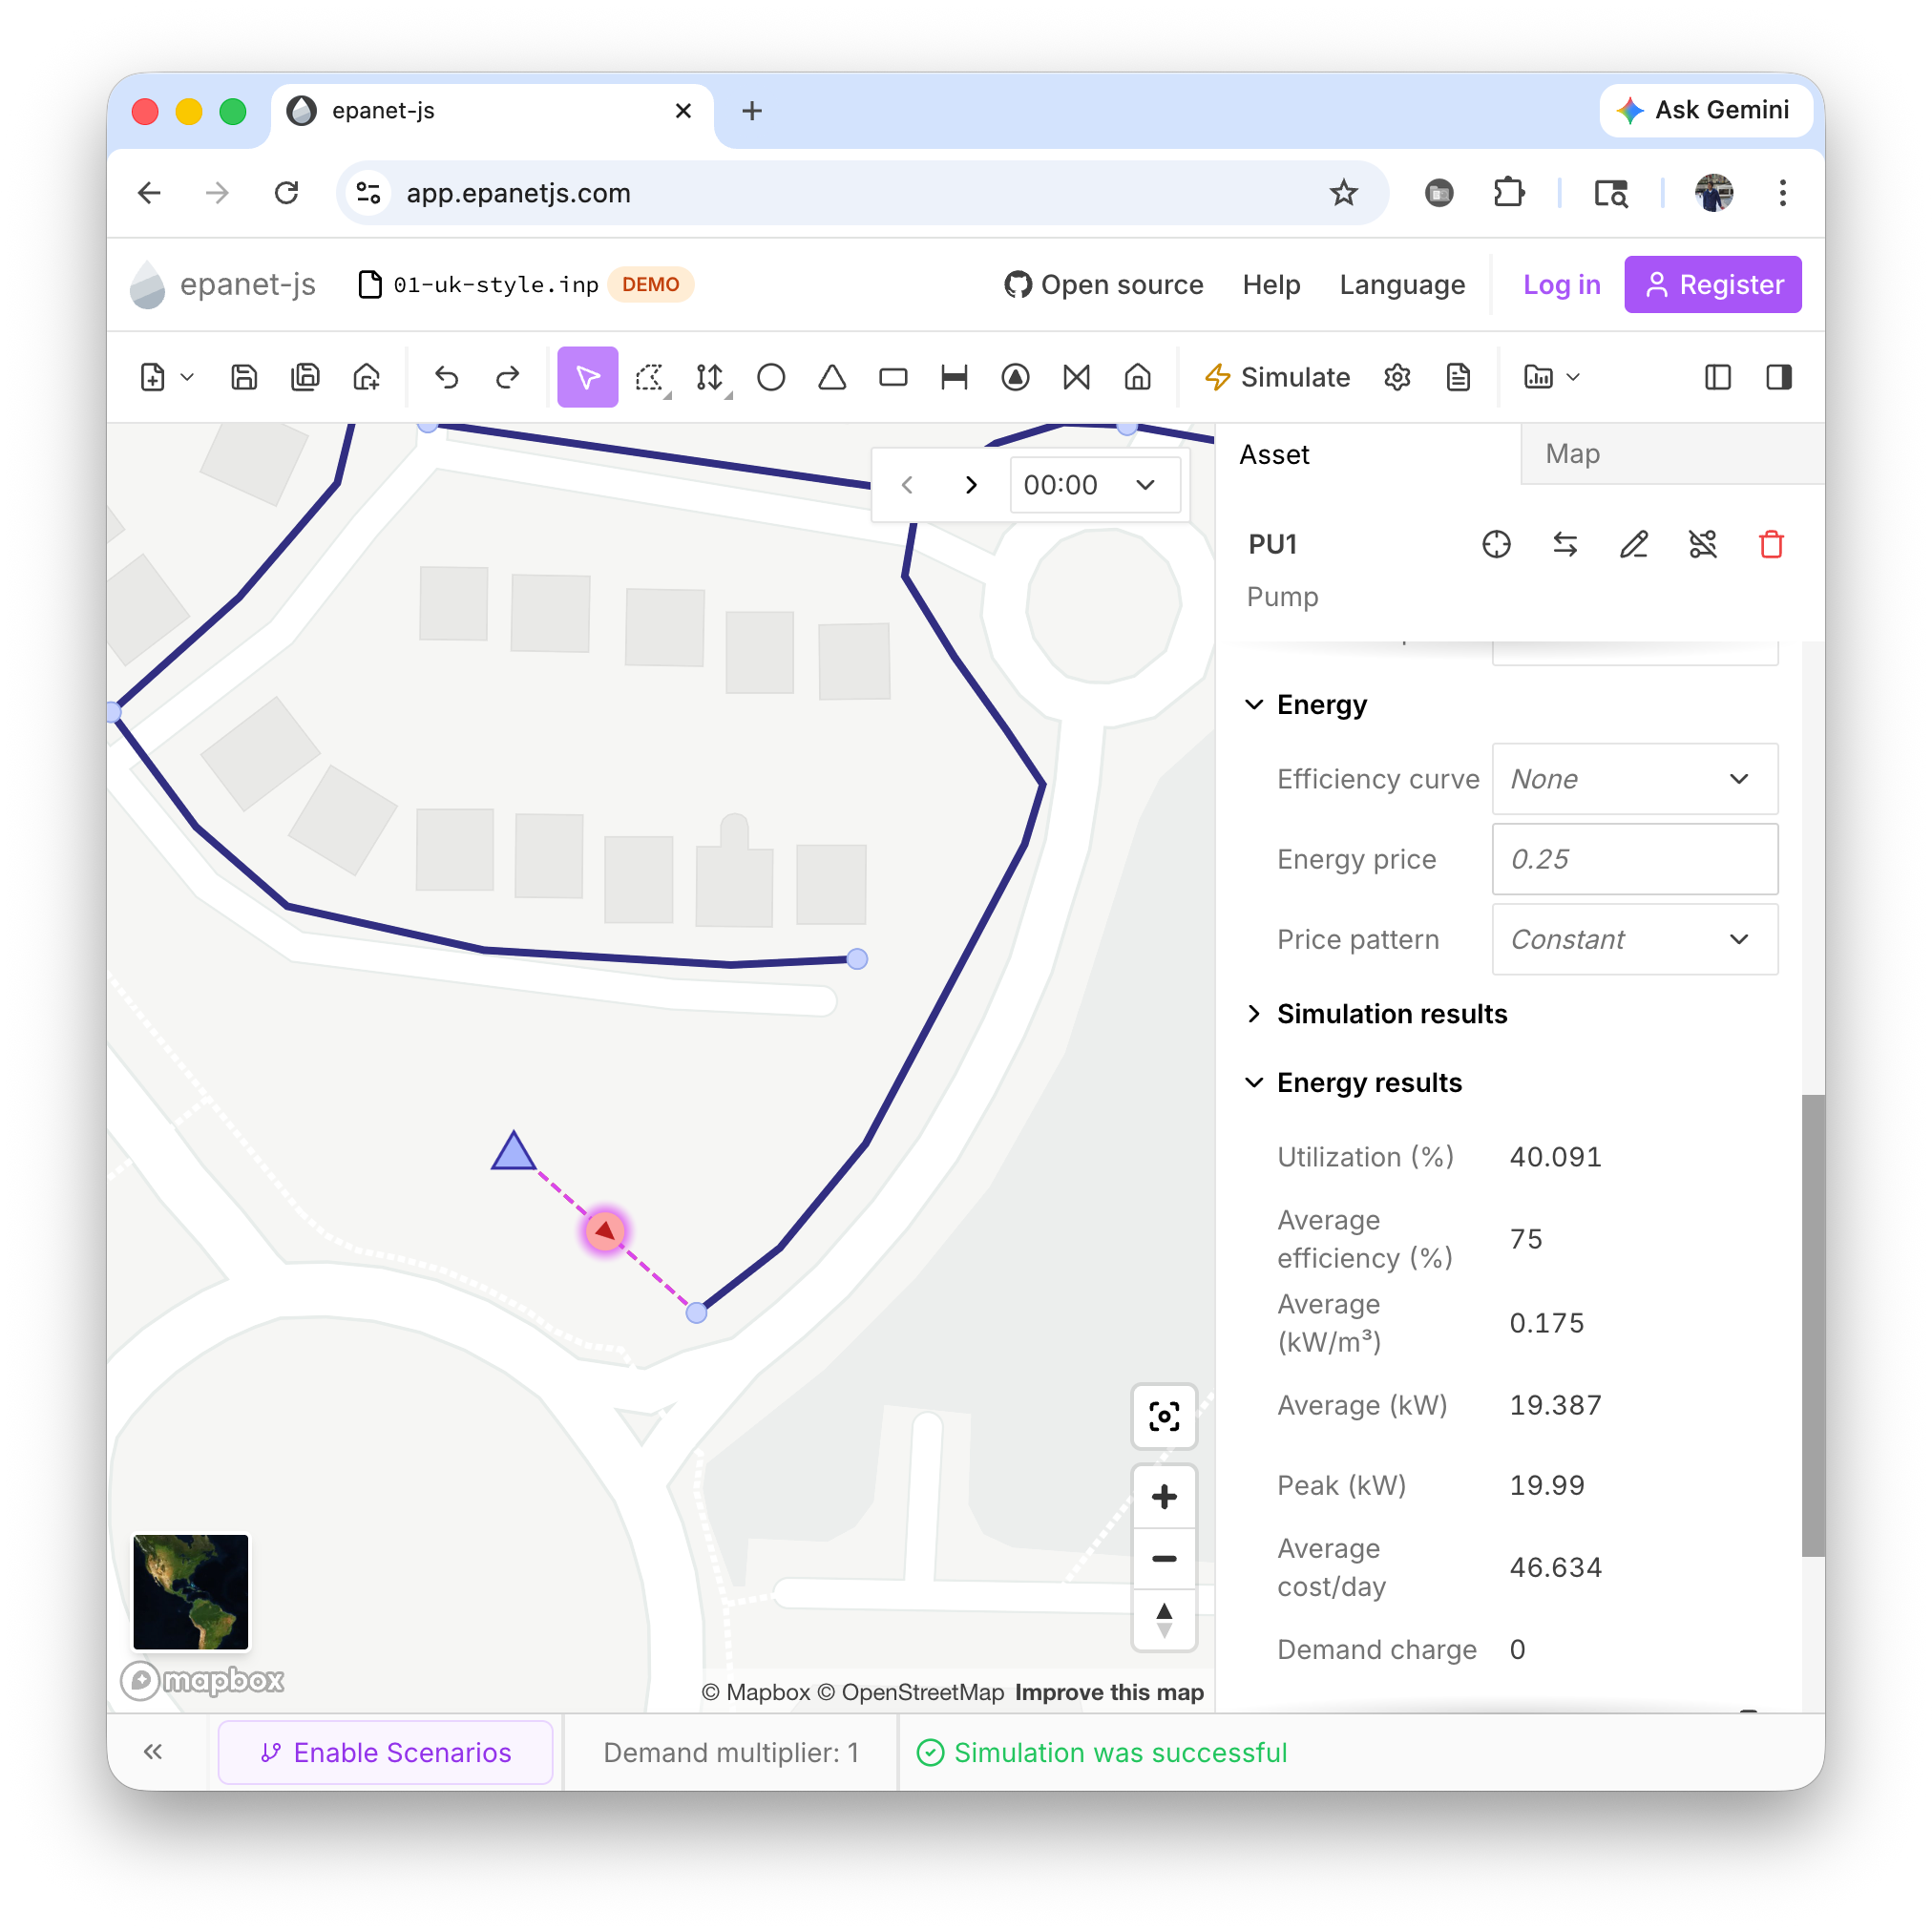
Energy consumption data is now available for pumps. When you select a pump, the asset panel displays an Energy Results section (above the simulation results) showing:
- Utilization — percentage of time the pump is running
- Average Efficiency — from the assigned efficiency curve
- Average kW — average power consumption
- Peak kW — maximum power consumption
- Cost — average energy cost over the simulation period
To get energy results, you need to define your energy settings first. You can set efficiency curves, energy prices, and price patterns either globally in the simulation settings or individually on each pump.
Recent projects
We’ve added a Recent Projects list to help you get back to work faster. When you open epanet-js, you’ll see up to ten of the models you’ve been working on. Click any of them to jump straight back in. You can also access recent projects from the toolbar via the new project dropdown.
epanet-js still works entirely with files on your own computer — no cloud, no data stored on our servers. This feature simply lets the browser remember your local file paths so you don’t have to navigate through your folders every time.
This feature is currently available in all Chromium-based browsers; like Google Chrome or Microsoft Edge.
Improvements
- Emitter backflow control: A new toggle in the simulation options lets you disable emitter backflow. Previously, emitters under negative pressure could reverse and pull flow back into the system. With this option enabled, that no longer happens — another EPANET 2.3 capability now exposed in epanet-js.
- Disable default elevation source: You can now toggle off the Mapbox global elevation layer entirely from the Map panel if you want to rely solely on your own data.
- Custom node and link colors: In the Map tab, you can now pick the default color for junctions and pipes when no other visualization is applied. A color picker lets you choose whatever works best for your workflow.
- Collapsible asset panel sections: The asset panel now uses an accordion pattern, letting you expand or collapse individual sections to focus on the data that matters.
- Tank and reservoir net flow: When you select a tank or reservoir, a new Net Flow simulation result shows the amount of water entering or leaving at each time step.
- Improved dialog design: We’ve refreshed the visual design of our modal dialogs for a cleaner, more consistent look.
Bug fixes
- Fixed an issue where tanks and reservoirs were not highlighted at low zoom levels.
- Fixed a bug that prevented drawing new elements in a scenario while a color-by-property visualization was active.
- Fixed the map not clearing correctly when starting a new project from scratch.
- Fixed an issue when setting a library pump head curve on a pump that already had a local curve defined.
- Fixed an issue in the French locale where some numeric values could not be entered.
A milestone for the EPANET ecosystem
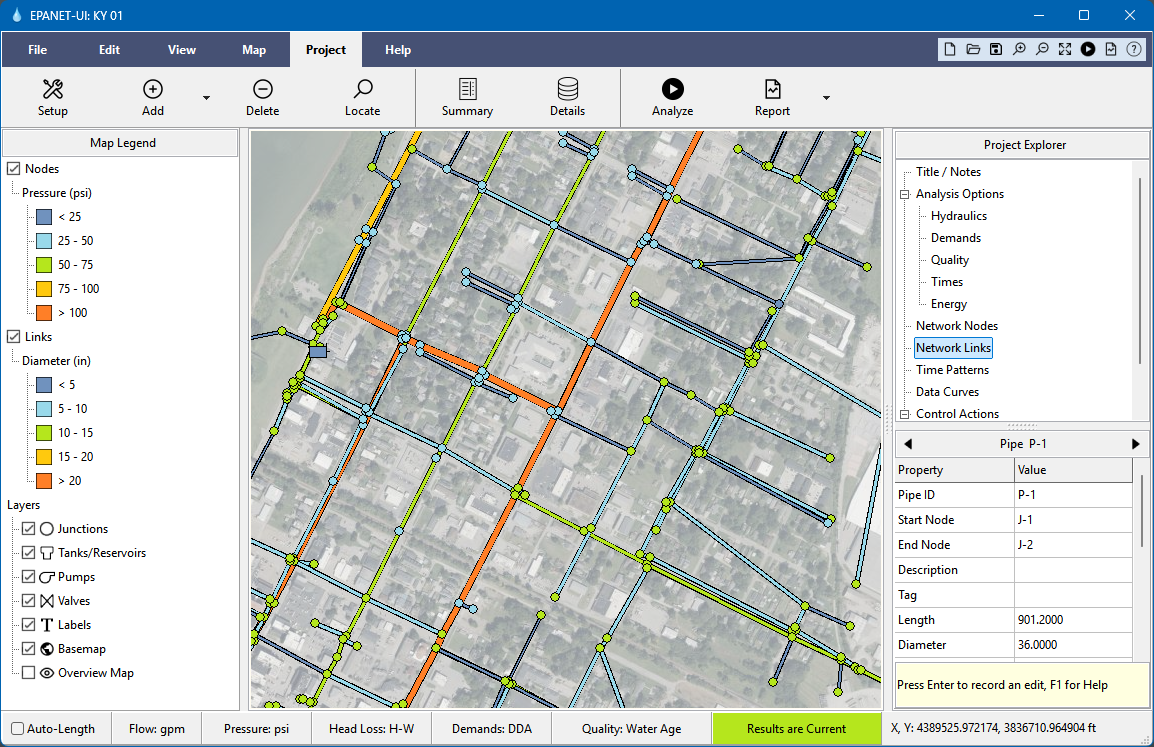
Lew Rossman, the original creator of EPANET, has released a new user interface as part of the version 2.3 release through Open Water Analytics. It’s the first new official interface in over two decades — a major step forward for the open EPANET ecosystem.
The new interface includes cross-platform support, integration with the EPANET 2.3 engine (pressure-dependent demands, FAVAD leakage), MSX water quality modelling, GIS and CAD import, web basemaps, and expanded reporting including energy audits and fire flow analysis.
What this represents is choice. If you want a traditional desktop interface closely aligned with the official engine, Lew’s new UI is the natural starting point. If you prefer web-based workflows focused on collaboration, epanet-js provides another path. Either way, it’s an exciting time for open hydraulic modelling.
Community and growth
2,000+ registered members
We crossed 2,000 registered members in March, and had our best month yet for active users — 2,606 unique people used the app. The growth continues to accelerate and it’s incredibly encouraging to see the community expanding.
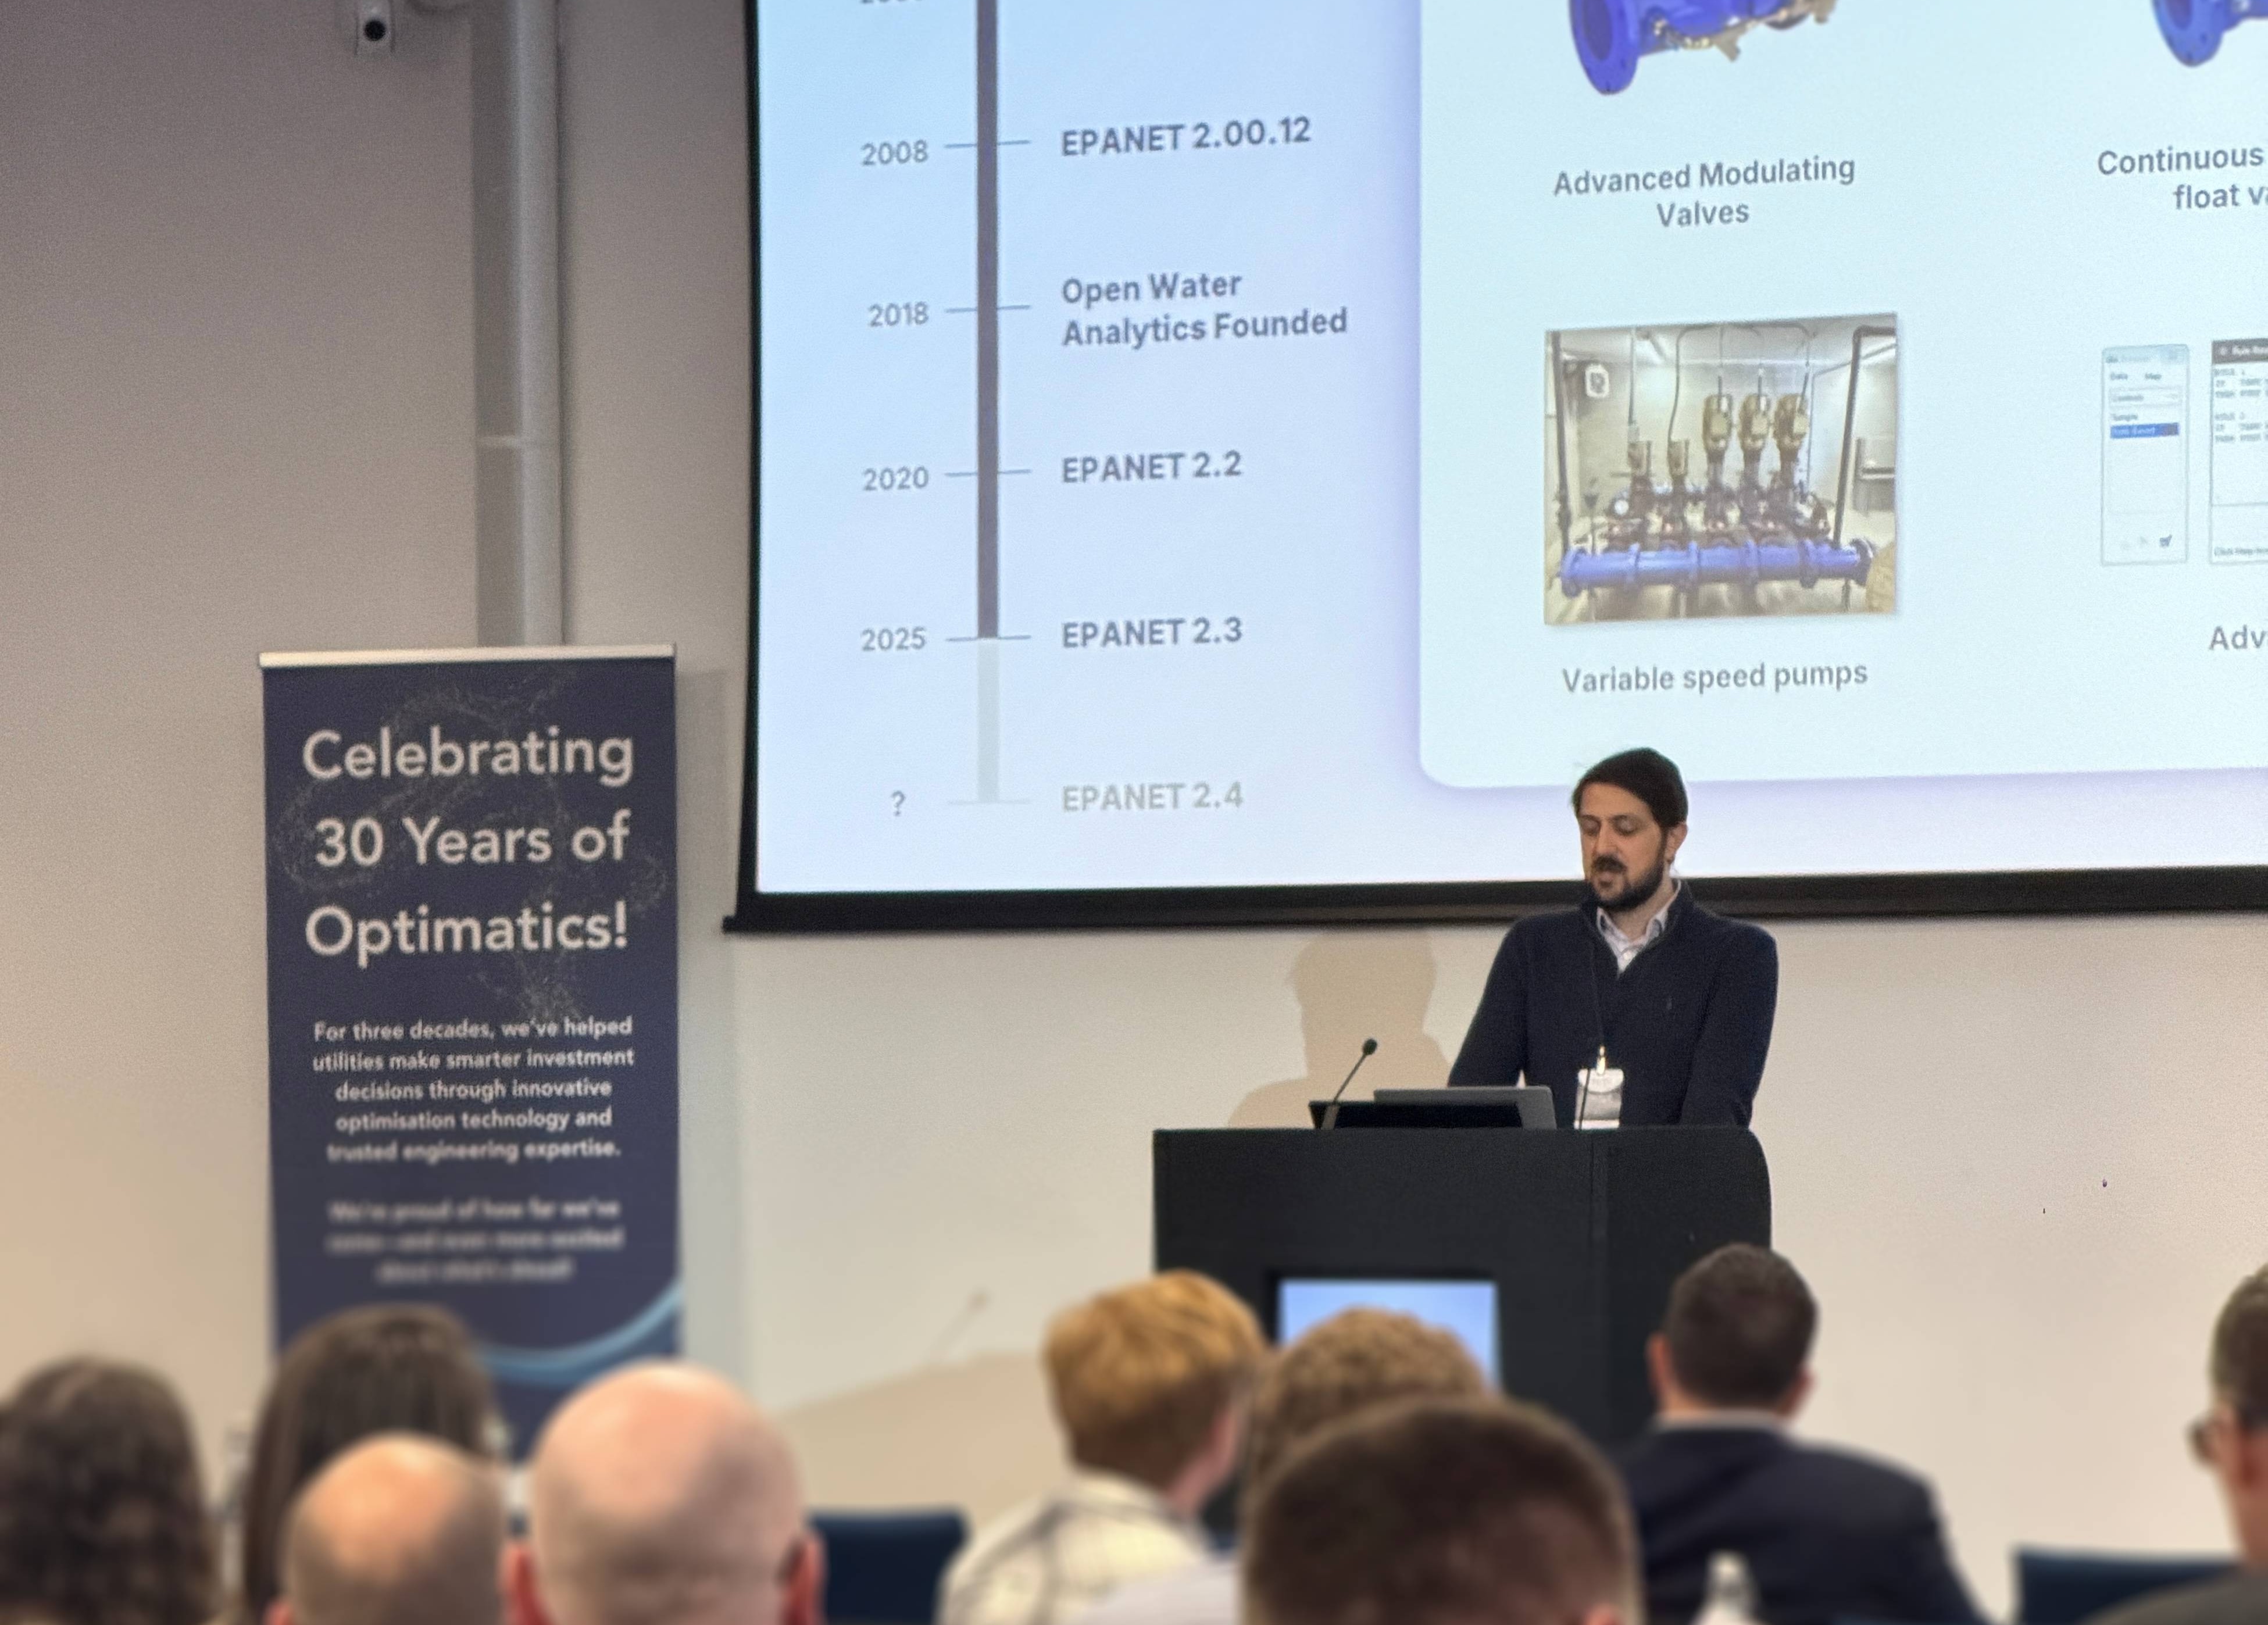
Optimatics UK User Conference
Thanks to Optimatics for inviting us to speak at the Optimatics UK User Conference. We had the chance to talk about the future of open hydraulic modelling and EPANET, and it was encouraging to see such strong support for the work the open-source community has been doing around the engine.
Two themes kept coming up in conversations. The first was the potential for a much more innovative ecosystem around water models — when the core tools are open and accessible, utilities can use their models in many more ways. The second was about access — not every utility needs, or can afford, large commercial modelling platforms, and a strong open EPANET ecosystem can give engineers everywhere the ability to run professional hydraulic analyses without the traditional barriers.
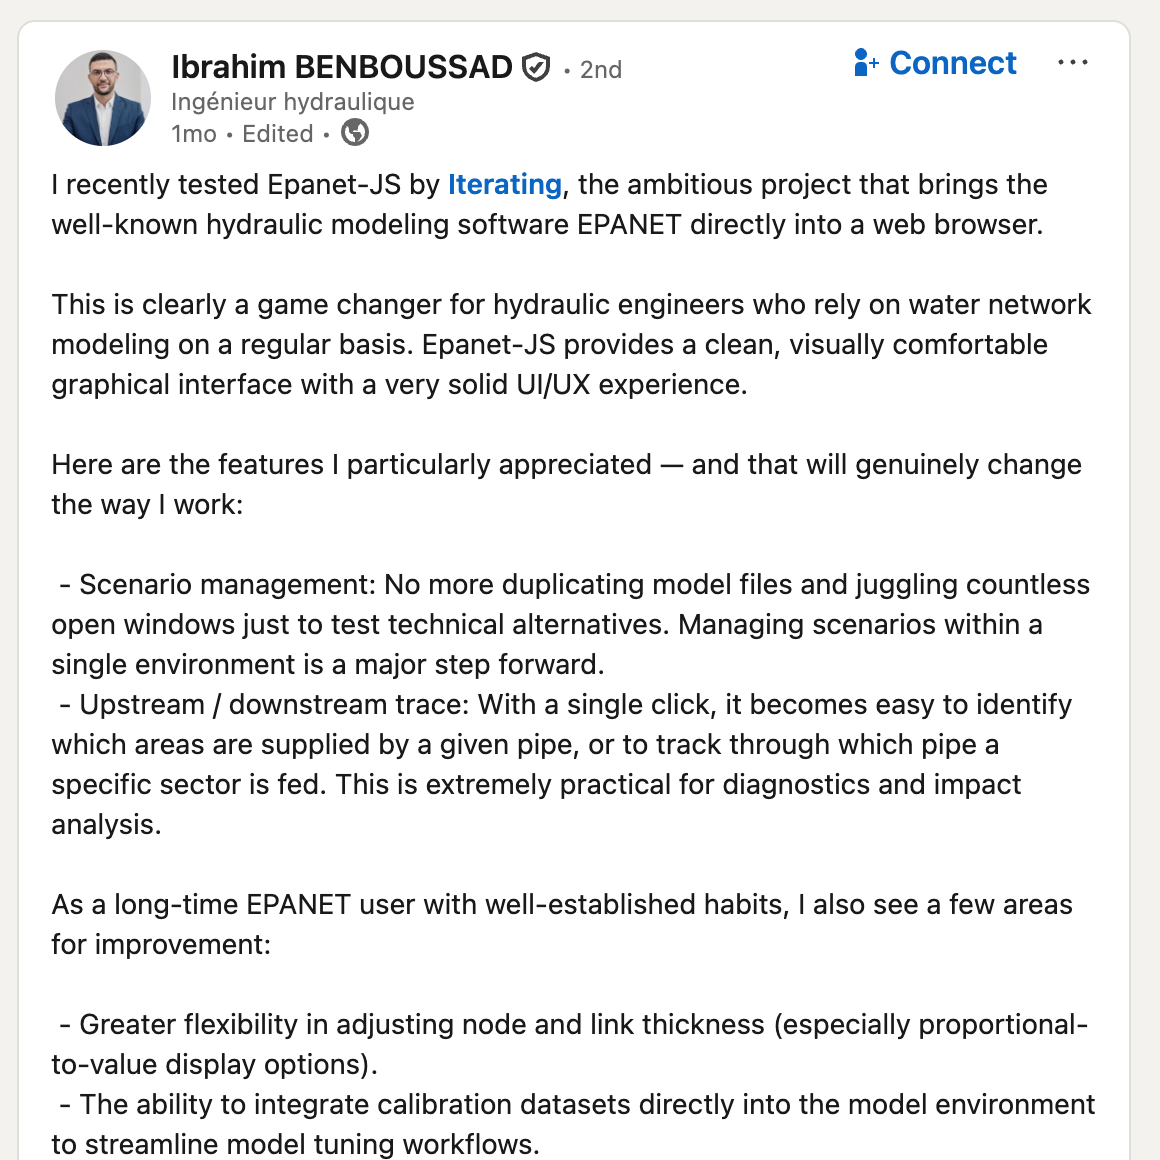
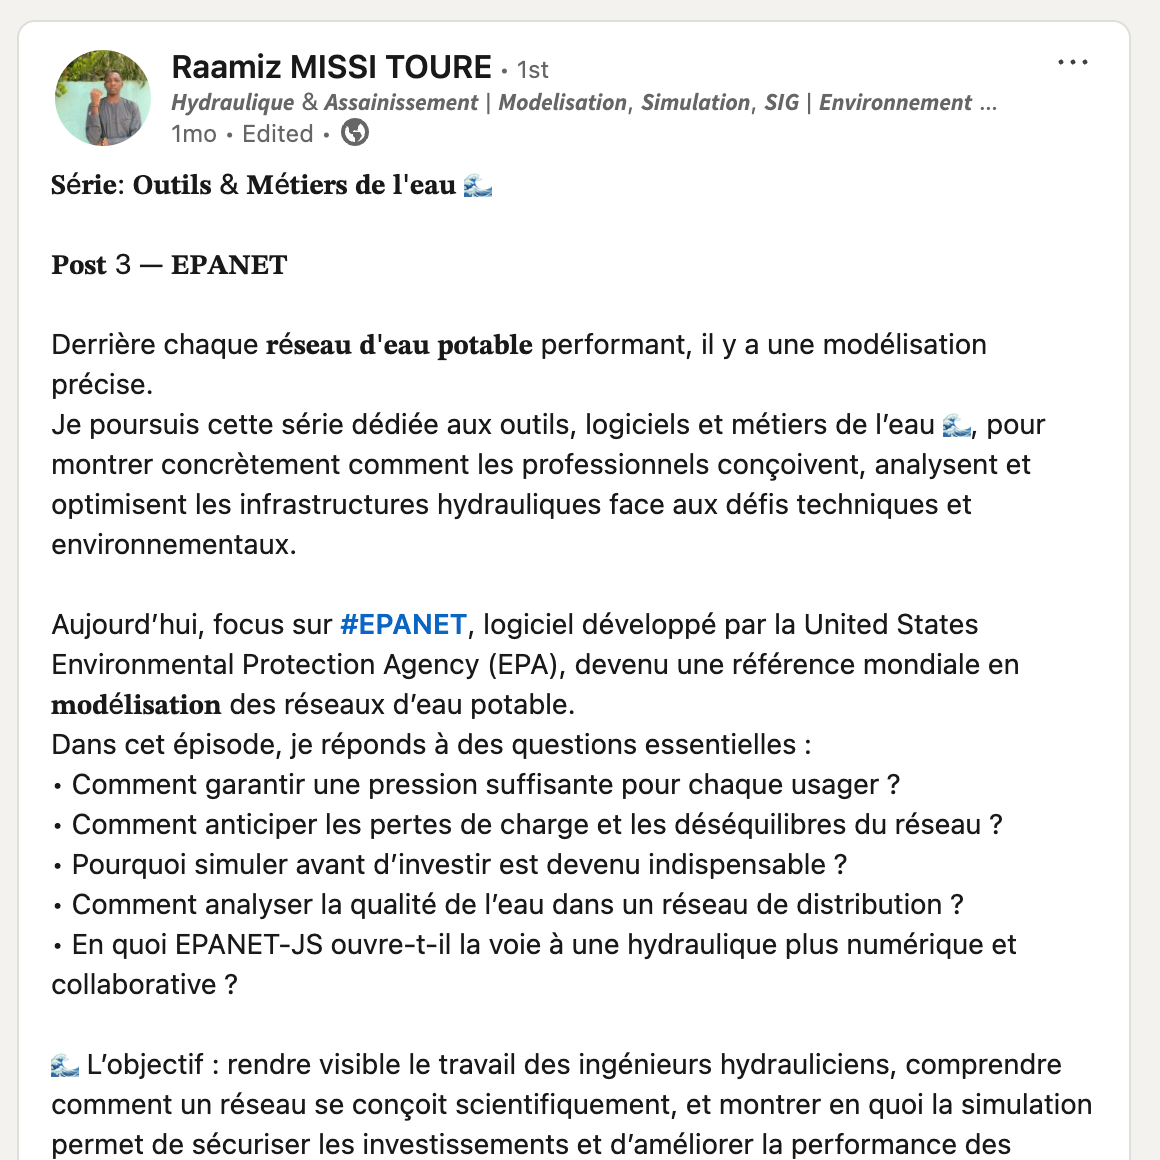
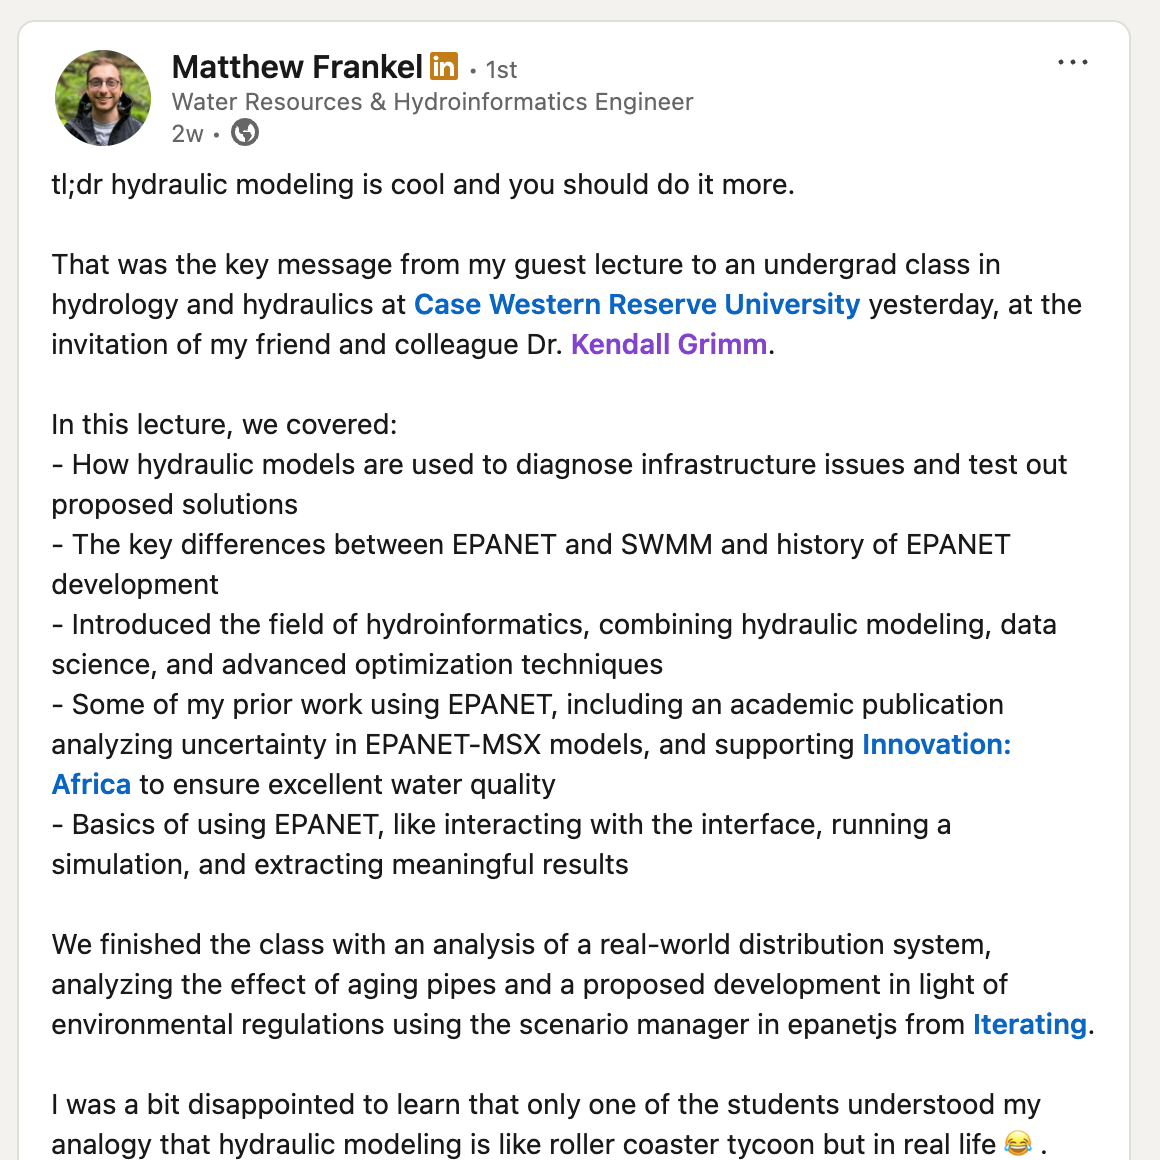
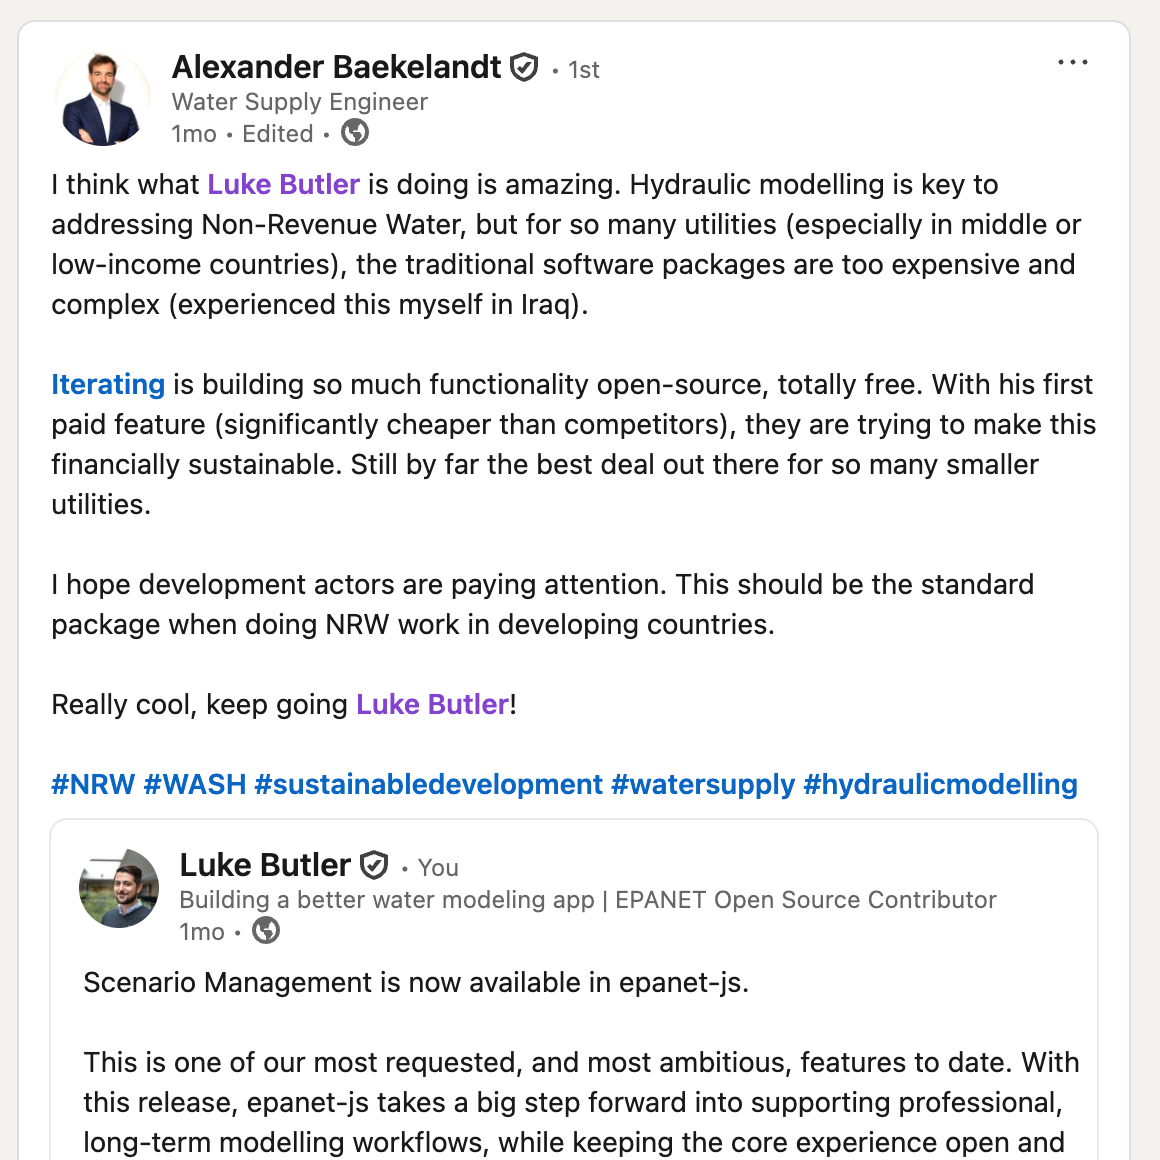
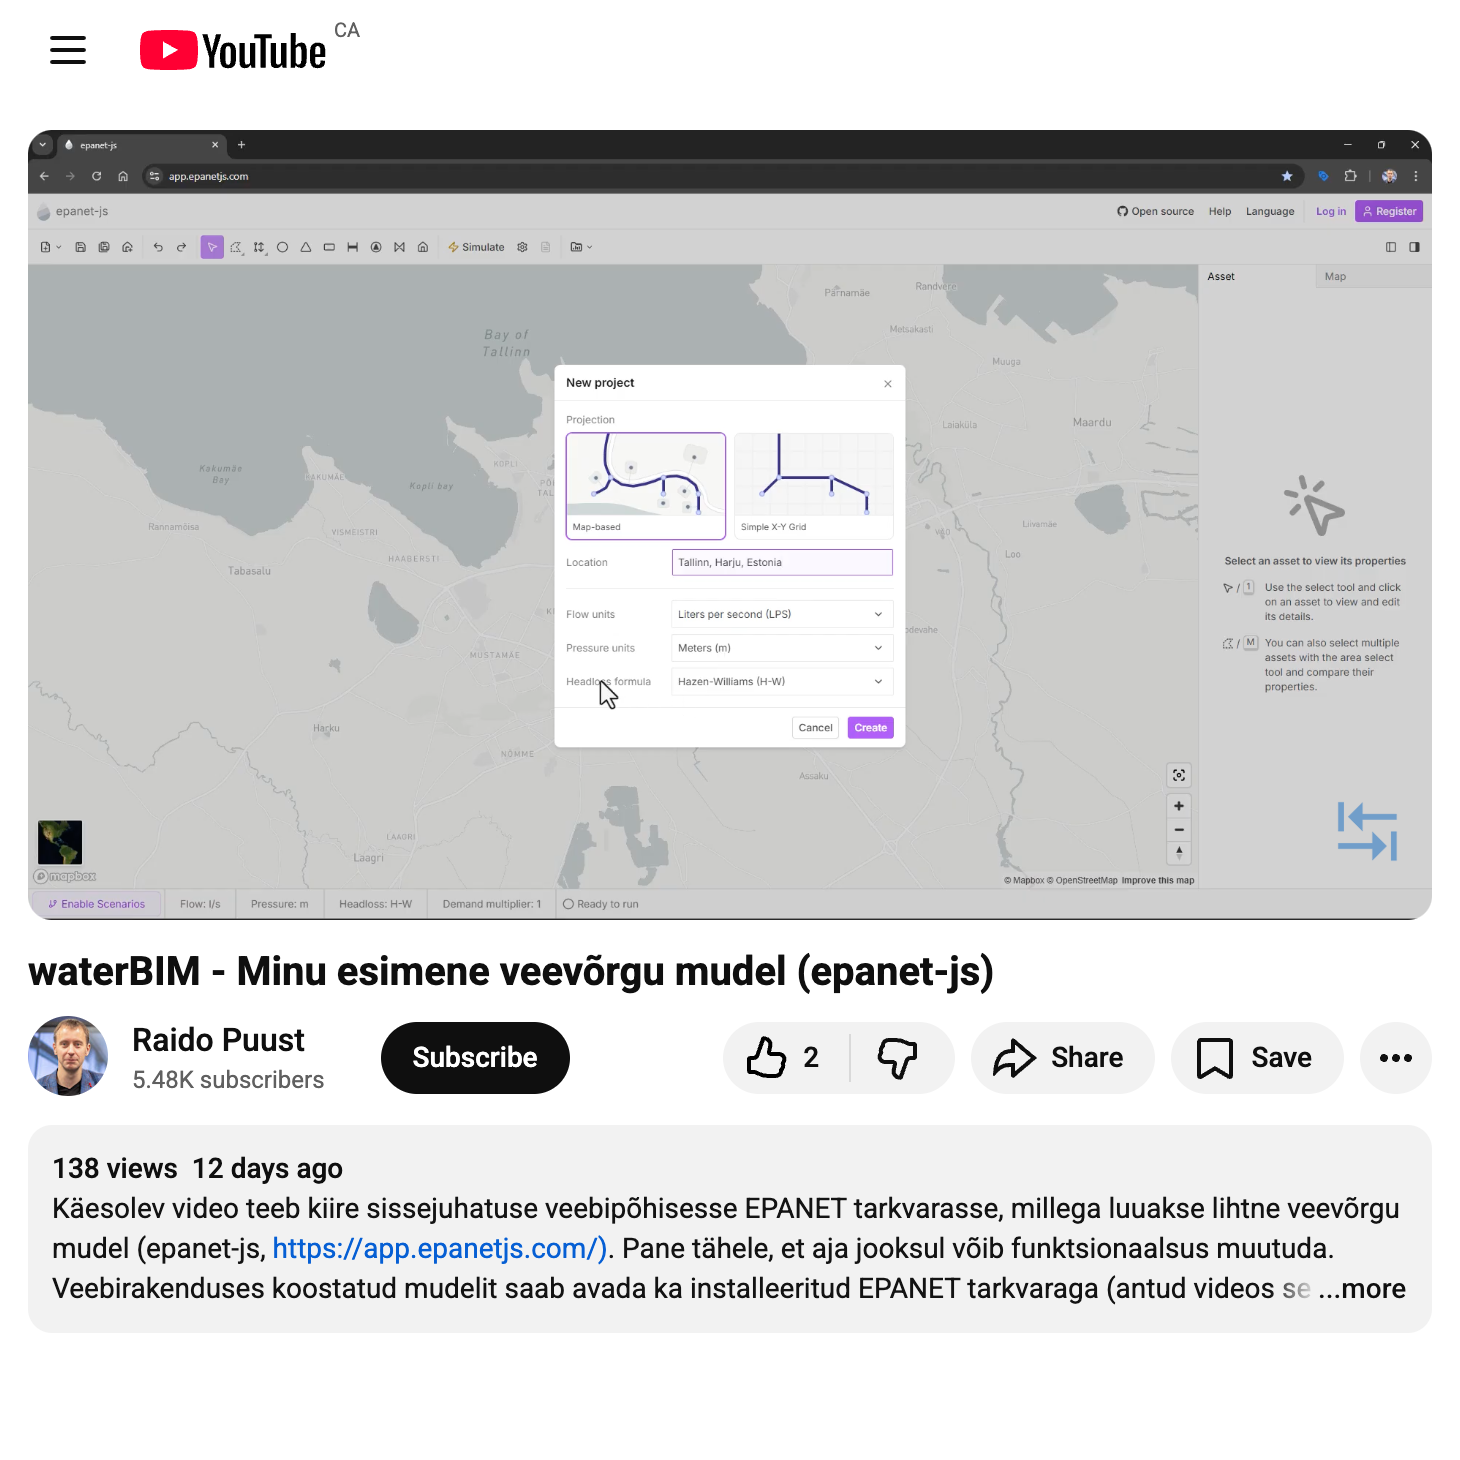
Community highlights
One of the most rewarding parts of this project is seeing how people all over the world are using epanet-js and sharing it in their own work. Here are some highlights from the community this month.

What’s next
We’re not slowing down. Here’s what’s coming:
- Water quality simulation: Starting with water age analysis — a highly requested capability.
- Team plan management: The ability to manage who is in your plan directly within the app.
- Model building tools: Zone polygons, user attributes, and more features to streamline how you build and organize your models.
Support EPANET by using software that supports it back.
— Luke and Sam