In-app scripting, over 100 upstream EPANET fixes, and interactive zones
October is one of our biggest releases to date. In-app scripting is now live for all users, so you can automate custom hydraulic calculations and reporting without juggling spreadsheets. Pressure zones are now interactive network assets, and every plan uses the same model builder.
We also contributed patches upstream for 109 bugs in the core EPANET engine. Outside the app, more than 300 universities and colleges now teach with epanet-js, and we’ve completely redesigned epanetjs.com.
In-app scripting
Paid plansEvery engineering team has custom workflows that generic modeling software doesn’t support out of the box. Until now, handling those jobs meant exporting raw results to Excel, manually piecing together lookups, or clicking through assets one by one to verify attributes.
With in-app scripting, you write short JavaScript routines that run against the network model you have open in epanet-js.
Take a renewal shortlist. A script ranks your pipes by age, material and simulated velocity or head loss, then saves the shortlist as a selection set for review.
Scripts can read your model and the results of the last simulation you ran, and they can also edit the network, such as batch-updating pipe diameters or scaling demands.
Scripting is available on paid plans, with free access on our demo networks. Users on the free plan can also open and run the built-in examples against their own networks.
What you can do with it
The renewal shortlist is one example. Scripting is designed for the real-world modeling tasks that usually end up in a spreadsheet.
Some of those are reviews of simulation results. A pump performance review can summarize each pump’s utilization, efficiency, peak power and daily cost, count how often it starts and stops, and flag the time steps where it can’t deliver its flow or head. A tank turnover check can track each tank’s level through the run, flag tanks that never properly drain and refill, and compare their water age against your targets.
Others are questions you get asked. For a new connection enquiry, a script can find the mains within a set distance of the proposed connection, with their diameters and the pressure range at the nearest junctions. For client and regulatory reporting, it can extract custom summaries from simulation runs, such as minimum pressures by DMA or pipe head loss gradients across critical transmission corridors.
And some are checks on the model itself. For QA/QC and auditing, you can scan incoming client models for common errors, such as check valves pointing against hydraulic grade, localized negative pressures, or orphan nodes, before spending hours running calibrations. For routine maintenance, you can audit pipe libraries, verify that custom roughness coefficients match asset age and material, or make sure demand patterns are assigned correctly across your entire network.
What scripts can read and change
Scripts can read your model and the results of the last simulation you ran, and they can make changes to the model:
- Assets and properties: pipes, junctions, valves, pumps, tanks, reservoirs, customer points, operational controls, and custom attributes.
- Simulation results: pressures, flows, velocities, and head loss at any time step, the minimum and maximum pressures across the run, and pump energy summaries.
- Hydraulic traces: trace pressure zones, track simulated flow upstream or downstream, and isolate paths based on valve positions, flow direction, or travel distance.
- Spatial and connectivity checks: query assets within a radius or polygon, locate crossing pipes, flag disconnected segments, and identify nodes sitting near pipes they aren’t linked to.
- Model edits: change asset properties such as pipe diameters, roughness and valve settings, replace demands and water quality sources, edit patterns, curves, controls and the pipe library, and set custom attribute values. A script’s changes are applied together when it finishes, and if it fails, none are applied.
Built-in examples and output
You don’t need to write scripts from scratch. Open Scripts in the activity bar to find examples for common tasks, such as a pipe length breakdown by diameter for cost estimating, a trace of where a node gets its water, a check for unused pump curves and demand patterns, and a CSV export of your pipes.
When a script finishes, its results appear in the Script output tray at the bottom of the screen: tables, color-coded warnings and errors, and any files it creates, which you can download one at a time or together as a .zip. Scripts can also highlight assets on the map and zoom to them. Selection sets and bookmarks a script creates wait in the output until you save them to Collections, so rerunning a script doesn’t clutter your project.
Write scripts with AI (and a built-in assistant next month)
If you don’t write JavaScript, you can let an LLM write the script for you. We provide a structured documentation file at llms.txt that describes the entire epanet-js scripting library in a format AI models understand.
Copy the content of llms.txt, paste it into ChatGPT, Claude, or your preferred assistant, and describe what you want the script to do. For example: “Find all 150mm ductile iron pipes older than 30 years where simulated velocity exceeds 1.8 m/s, and print them as a table.”
Next month, we are integrating an AI scripting assistant into the epanet-js editor, so you can generate and refine scripts inside the app by describing what you want in your own words, in any language.
Zones as first-class assets
Pressure and district metered zones used to be passive reference overlays. They are now interactive, selectable assets, available on every plan.
Click inside any zone on the map to open its properties panel. It shows the highest and lowest elevations across all the junctions inside, and the minimum and maximum simulated pressures from the last hydraulic run.
From there, Select contents selects every asset inside the zone at once, plus its customer points when they’re shown on the map. That makes it easy to work with a whole DMA or create focused selection sets.
Zones also now appear in data tables, global search, selection sets, and asset data exports. On paid plans, you can assign custom attributes to them, such as DMA target leakage rates, target pressure bands, or commissioning dates.
One model builder for every plan
We have retired the legacy model builder. Every signed-in account, free and paid, now uses our modern, full-window model builder.
Free and Personal plans can build models of up to 100,000 assets from Shapefile, GeoJSON, DXF, and CSV files. Pro or higher adds custom filtering, file stacking, recent builds, and models over 100,000 assets.
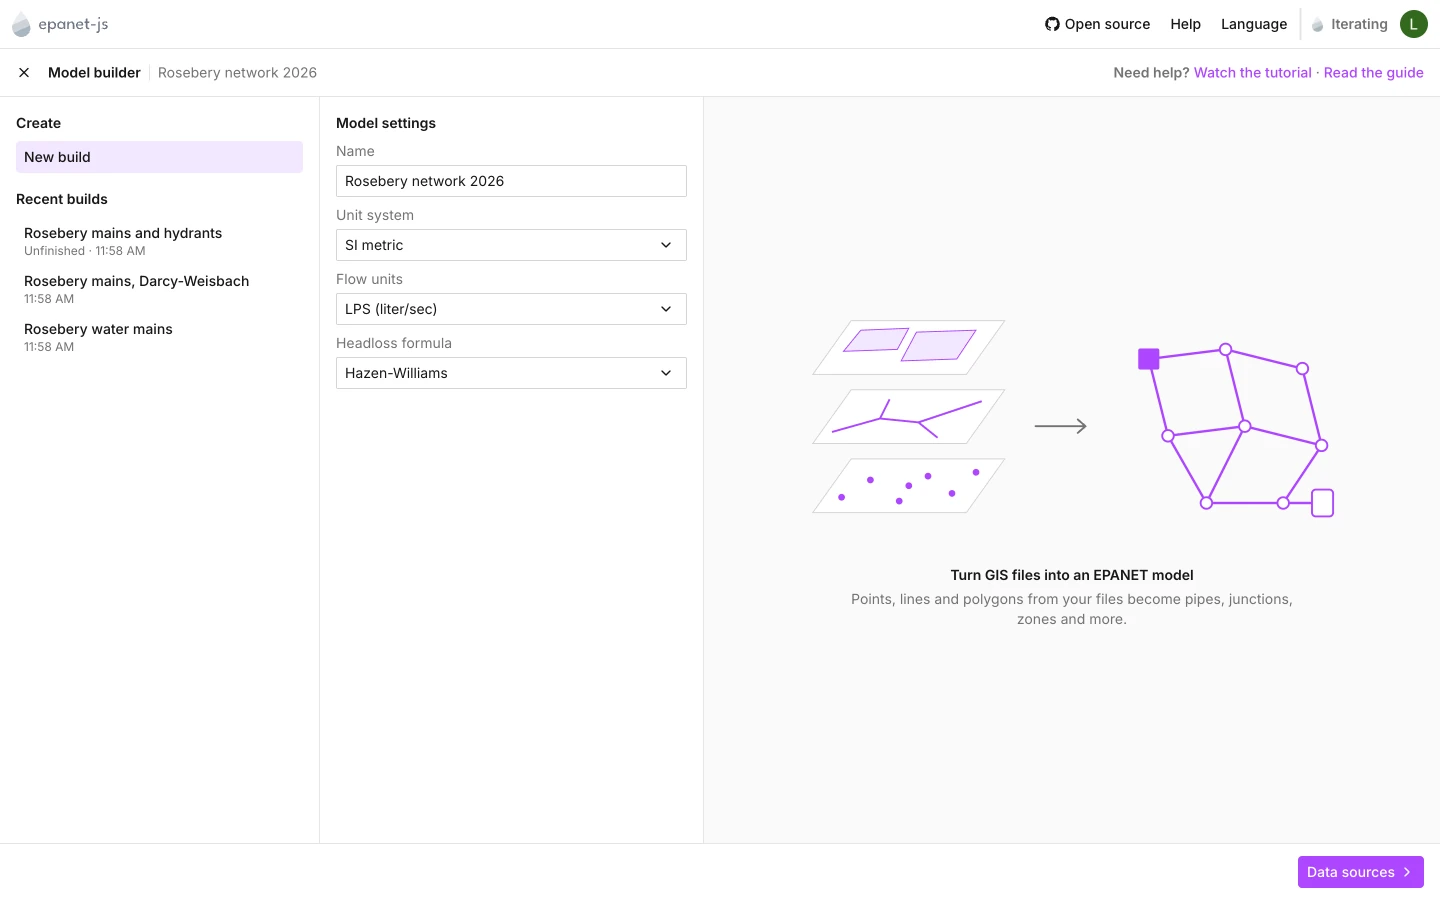
The model builder now fills the window, with your recent builds on its first screen.
Never lose your build configuration again
The biggest frustration with the original model builder was workflow interruption. If you mapped an attribute incorrectly, needed to check a GIS field name, or accidentally closed the window, your entire configuration was lost and you had to start from scratch.
On Pro or higher, the updated builder introduces automatic session recovery. Incomplete and recent builds are saved in your browser and listed under Recent builds on the builder’s first screen. Each one keeps its settings and the names of its source files, but not the files themselves.
When you start from a recent build, your source file mappings, layer selections, and custom attribute rules are restored as you left them. The builder lists every source file the build expects and marks each one as Not added yet until you add it again. If you try to continue without one of those files, it warns you before proceeding.
So you can close your browser or navigate to another view, then re-add your files and pick up where you left off.
More room, search, and cleaner imports
The builder now uses the full app window rather than a cramped modal dialog, which leaves plenty of room for wide attribute mapping tables and the preview map.
Columns with more than 20 distinct entries now include a search filter, so you don’t have to scroll through thousands of pipe materials or diameters. The import engine also catches more zero-length pipe segments and removes them earlier, before they can cause engine calculation errors.
Exporting scenarios and link results
You can now export the scenario you have open as a clean, standalone EPANET .inp file with all scenario-specific overrides applied (File > Export > Scenario as EPANET INP). If your scenario relies on advanced control features like remote set-point PRVs, the exporter will advise if EPANET-LSX is required.
Bulk simulation exports (File > Export > Simulation results) now include water quality results for links alongside node results. That’s water age, chemical concentration, or source trace, whichever you simulated.
Over 100 EPANET bugs fixed upstream
epanet-js runs on the standard EPANET engine, so improving the engine benefits the entire water industry. That includes users running desktop EPANET and commercial software packages built on EPANET’s source code.
At the start of October, we shared an in-depth review of the EPANET 2.3 C source code, carried out with the help of Claude, Anthropic’s AI model. The review ran the engine with memory sanitizers and undefined-behavior checkers, fuzz-tested it with 1,500 mutated input files and random sequences of toolkit calls, and went through every module of the code.
It identified 109 bugs, the vast majority of which were previously unreported. Many were edge-case input handling issues. But 29 silently produced incorrect simulation results, and 31 could crash the engine or access invalid memory.
What the review found
One of the significant findings was in the water quality solver, which treated pipes with check valves as having zero volume. Water moved through them instantaneously, without decay or travel time, distorting chlorine residual calculations and water age downstream.
A few others are worth calling out. When a tank emptied, the solver continued allowing it to supply water for up to an entire hydraulic time step afterwards. Energy calculations multiplied the demand charge by the energy tariff twice, and the charge grew again on every simulation run. And reservoir level controls triggered on every single time step, regardless of actual hydraulic head.
Fixed upstream for EPANET 2.3.6
We compiled reproducible test cases, technical explanations, and proposed patches in our public review repository and submitted them to the Open Water Analytics (OWA) maintainers.
Lew Rossman, the original developer of EPANET, verified our test cases and merged the fixes across four pull requests. César on our team contributed a final follow-up patch, and fixes for 99% of the identified bugs are now merged into EPANET’s development branch. They will ship broadly in the upcoming EPANET 2.3.6 release.
A huge thank you to Lew, who did the heavy lifting of verifying and merging every one of these fixes, and to all the volunteers who put countless hours into EPANET for the community’s benefit.
300+ universities and colleges
More than 300 universities and colleges across 68 countries are now using epanet-js to teach hydraulic modeling.
Desktop modeling software is notoriously difficult to deploy in academic computer labs and across mixed student operating systems. epanet-js runs fully in modern web browsers with no installation hurdles, which has made it significantly easier for educators to run hands-on distribution design labs.
Any student or educator who signs up with their school email automatically receives free access to our paid modeling tier. You can explore the universities and colleges teaching with epanet-js on our new Education page.

More than 300 universities and colleges in 68 countries now teach and learn with epanet-js.
A rebuilt epanetjs.com
We have also completely redesigned and expanded epanetjs.com.
Over the past 15 months, epanet-js has grown far beyond the app we first launched. It is now a complete modeling environment used daily for master planning, operational assessments, and network design, and our website needed to reflect that.
The new Solutions pages show how epanet-js handles each phase of engineering, from importing messy GIS data and automated model assembly to running 24-hour water quality simulations and pressure zone management. Alongside them are solution guides tailored to municipal water utilities, engineering consultancies, humanitarian and NGO response teams, and academic institutions.
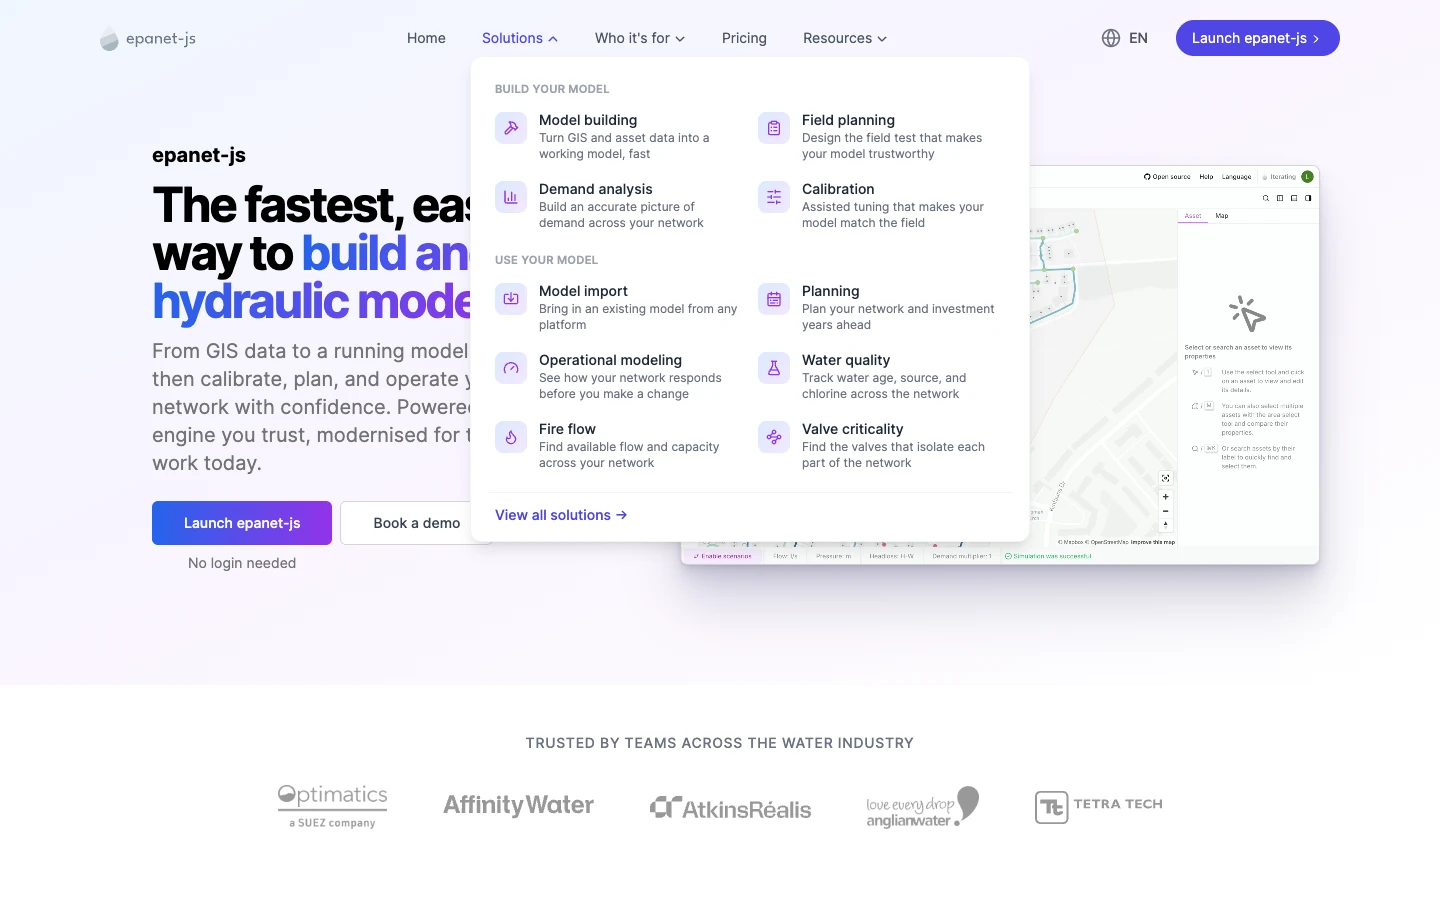
The new epanetjs.com, with a page for each stage of modeling under Solutions.
There are also objective comparisons of epanet-js with traditional packages like InfoWater, WaterCAD/WaterGEMS, and InfoWorks WS Pro. We highlight where traditional tools still excel, where epanet-js offers major speed and workflow advantages, and how teams can run them side by side.
A central resource hub gives you direct access to technical case studies, our public product roadmap, help center tutorials, and the open-source toolkit. And if you want to evaluate epanet-js against your organization’s active network models, you can book a live engineering walkthrough through the site.
Minor improvements and fixes
Simulation and analysis
- Hydraulic step synchronization: Pump operational status and tank levels now synchronize with the reporting time step when smaller hydraulic calculation intervals are used.
- Map color ranges: Missing or partial simulation results no longer skew map color ranges or show flow arrows and labels.
- Pump control validation: Network Review now flags variable speed pumps whose target nodes, links or tanks, lag pumps, or start/stop tanks are inactive. The pump controls editor also requires pressure targets to be above zero.
UI and usability
- WebGL context recovery: The canvas renderer now recovers from browser graphics resets without requiring a full page refresh.
- Reprojection state: The unsaved-changes indicator now flags properly after applying coordinate reprojections.
- Wizards and panels: Added custom attribute selection to the customer point import wizard and fixed scrolling in the customer point panel.
Coming next
- Native AI scripting assistant: Generate, debug, and run custom automation scripts using natural language prompts inside the app.
- Flow-modulating pressure reducing valves: Model valves that adjust their pressure setting based on flow.
- Collection folders: Group and organize selection sets into structured folder trees.
- Multiple simulations per scenario: Set up baseline hydraulics, extended period water quality, and fire flow simulations under one scenario, and switch between them.
- Demand scaling by zone: Scale demands zone by zone, now that zones are first-class assets.
- Sensor data and calibration: Bring field and sensor data into a model to calibrate it.
- Custom graphs and scenario comparisons: Build graphs of your own design, and view scenarios side by side.
Support EPANET by using software that supports it back.
— Luke and Sam