Allocate consumption at the meter level, assign diurnal patterns by customer class, and reconcile zone inflows against metered use.
No login needed
Even a network with perfect GIS geometry will produce misleading pressures and velocities if demands are poorly assigned. When consumption relies on coarse top-down allocations or uniform peaking factors, those errors compound through calibration, planning, and operations.
epanet-js lets you build a bottom-up demand model grounded in actual meter records and DMA inflows, giving you a verifiable basis for every downstream simulation.
Represent consumption where it actually enters the system. Import customer meter points from your GIS or billing data, and assign them to the network using configurable proximity rules:
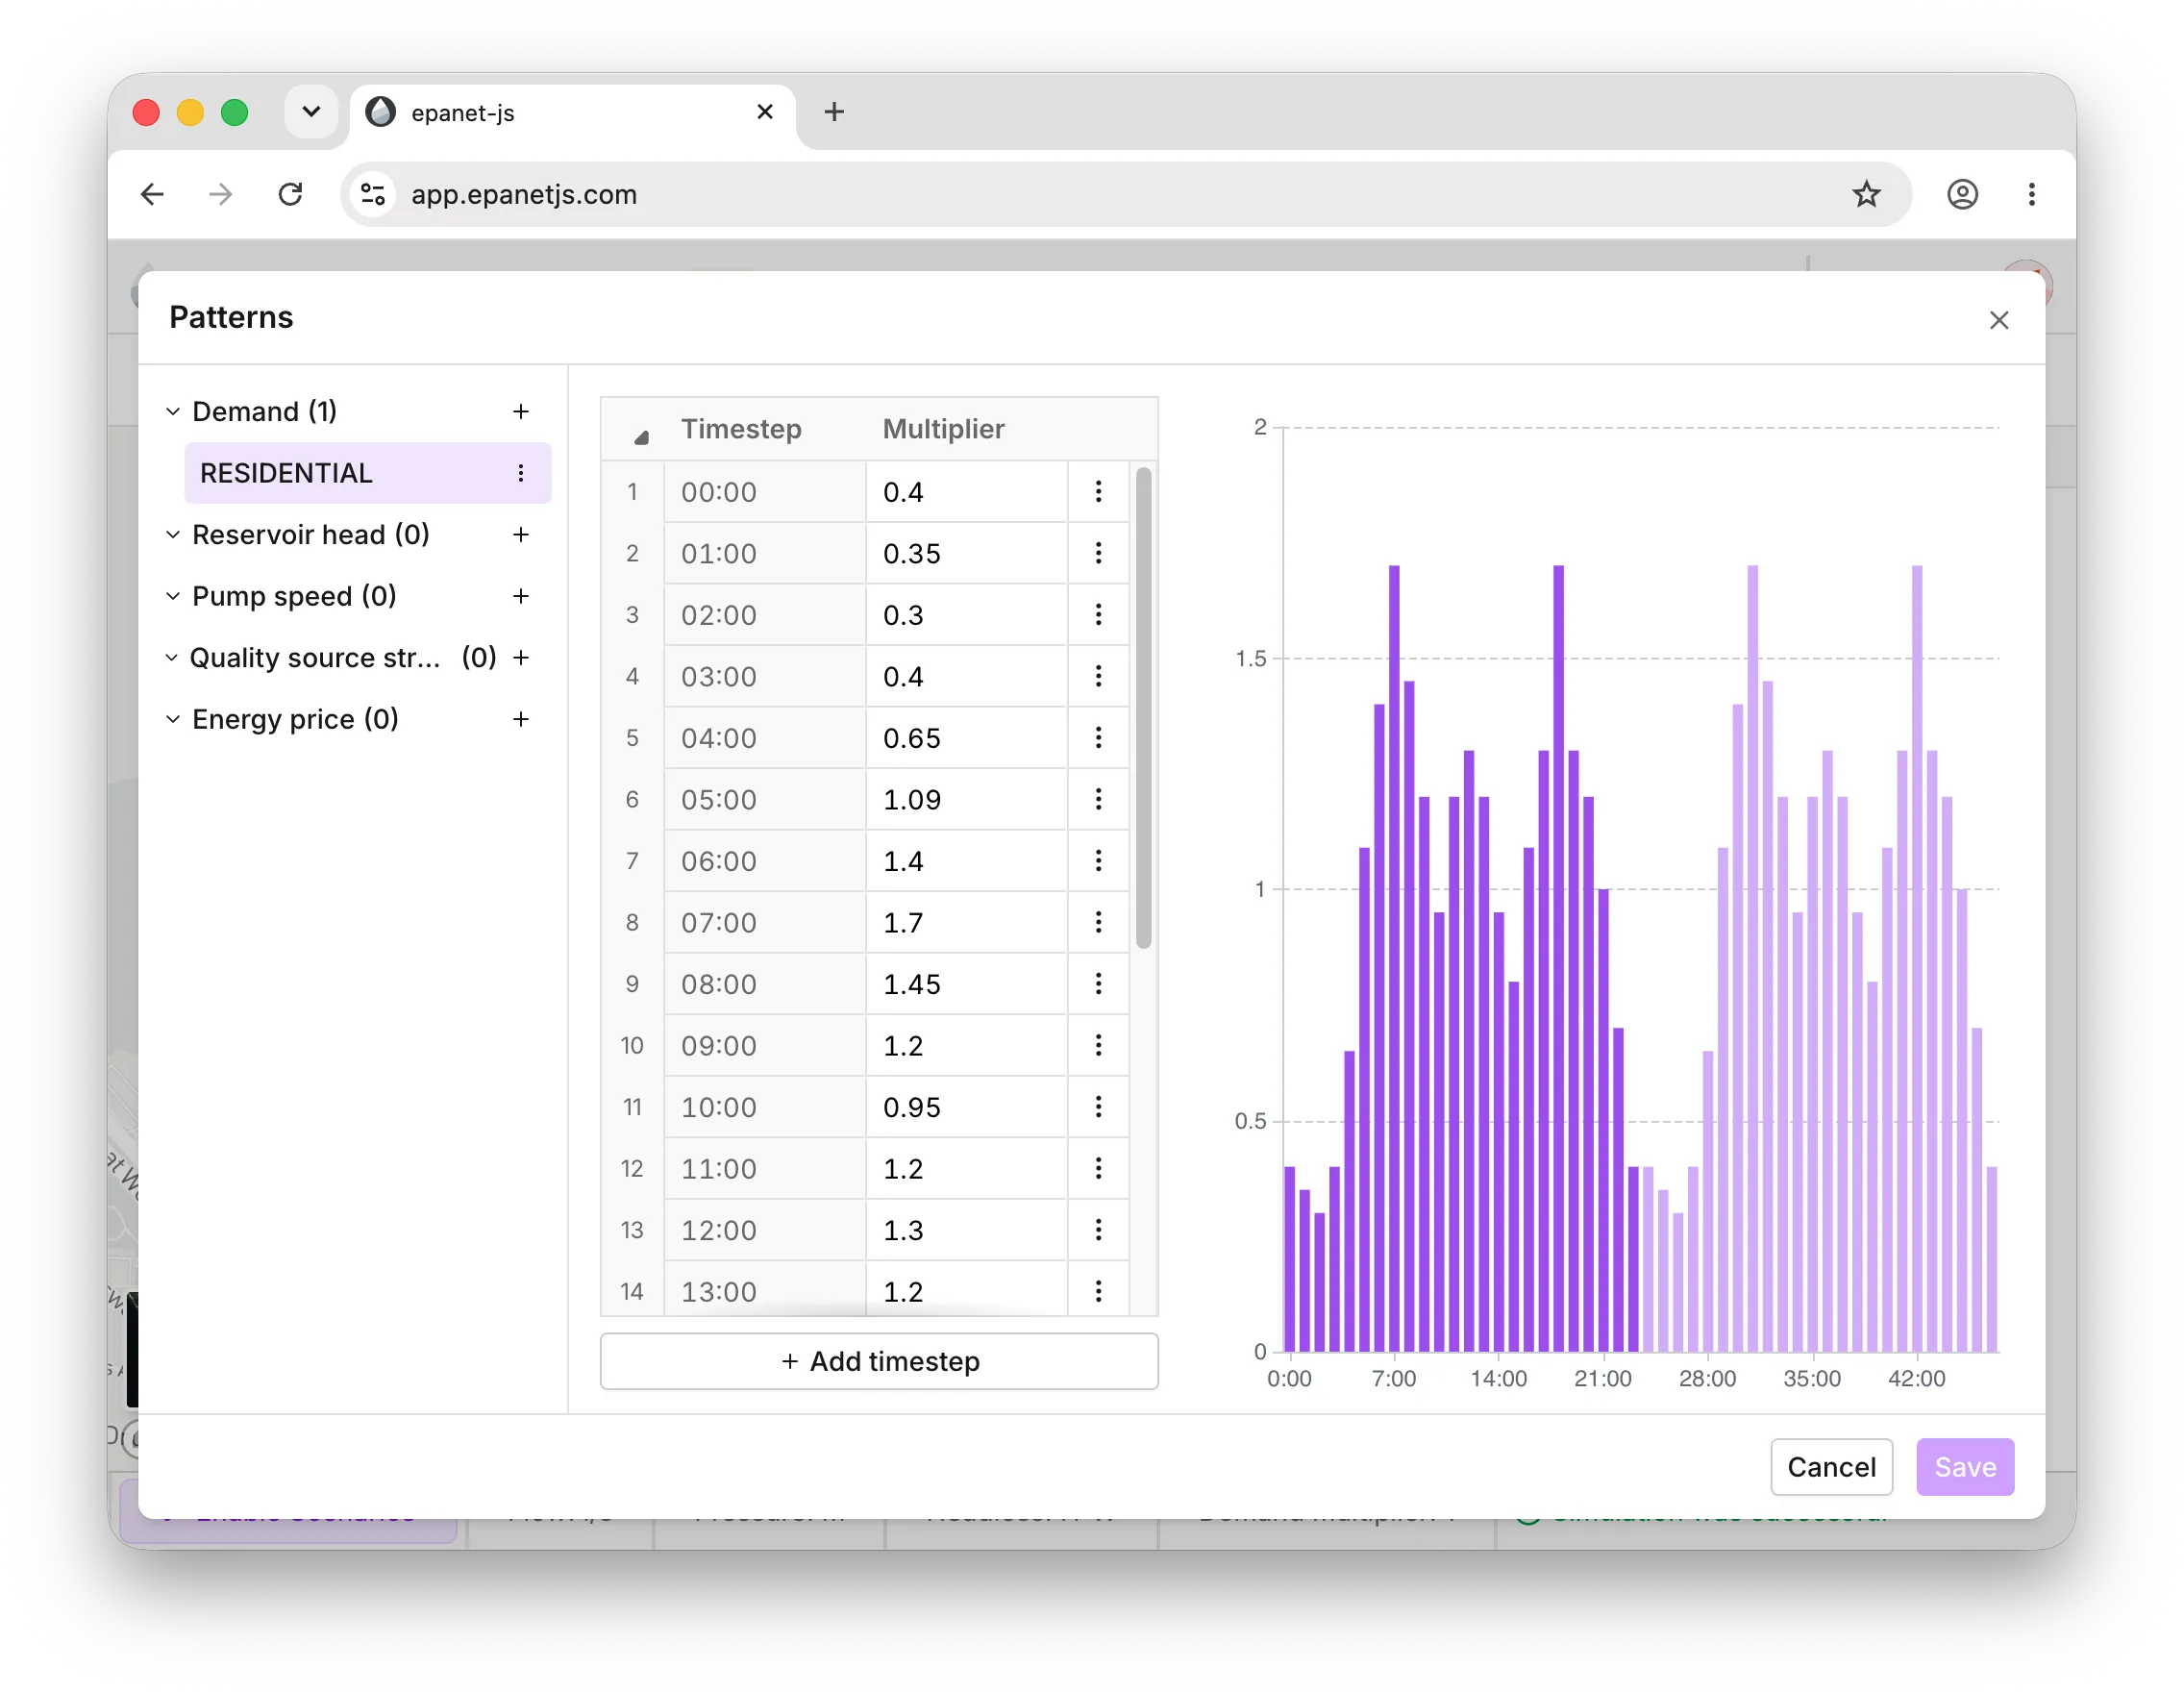
Assign time-varying consumption patterns directly from a project library or import them alongside your customer points. epanet-js supports multiple demand categories per junction, allowing you to separate residential, commercial, and industrial demand on the same node.
The network map shades dynamically by demand, making it easy to spot high-consumption zones and verify peaking patterns visually before running extended-period simulations.
Bring billing data and district meter readings into a unified water balance. epanet-js reconciles total inflow into each DMA against the customer demands assigned within its boundaries.
Instead of multiplying an assumed baseline by a generic peaking factor, use your metered inflows and diurnal consumption records to establish true average day and peak day demands directly from measured data.
Leakage isn't a static base demand. epanet-js supports both standard emitters and the EPANET 2.3 fixed and variable area discharge (FAVAD) model to simulate pressure-dependent leakage accurately.
As pressures shift across diurnal cycles or after operational adjustments, leakage rates adjust dynamically across each zone, so unbilled water behaves as it does in the field.
Pressure management
PRV-12
Automate district water balance calculations using logged night flow data. Compare minimum night flow (MNF) against estimated legitimate night use (LNU) to isolate background losses and burst leakage for each DMA.
By calculating non-revenue water per zone from logged data rather than applying a system-wide percentage, you can rank DMAs by leakage volume and target pressure management where it delivers the highest return.
Allocate consumption to the customers and meters that drive it, instead of spreading it evenly and hoping.
Apply demand patterns so consumption matches how water is really used across the morning and evening peaks.
Reconcile metered inflow with allocated consumption so every DMA in your network adds up.
Account for the water that doesn't reach a customer, so the gap between supply and use is explained, not ignored.
Import your customers, profile demand through the day, and balance every zone.
No login needed
Accurate demands lay the groundwork for everything that follows. In epanet-js, demand analysis lives in the same workspace as your network geometry and field observations, so your customer allocations feed directly into calibration and scenario planning without spreadsheet exports or external post-processing.
An accurate demand picture feeds everything downstream.
How demand allocation, patterns, and zonal balance work in epanet-js.
Build the demand picture your model deserves. Launch epanet-js free, or book a demo to walk through it with us.
No login needed