Simulate network operations before turning a valve in the field

Model valve isolations, pump schedule changes, main shutdowns, and emergency backfeeds. Observe system-wide hydraulic responses in seconds and maintain an auditable record of operational decisions.

Validate operational impacts before crews deploy

Closing an isolation valve, adjusting a PRV set point, or rezoning a supply area can address a localized issue while inadvertently creating low pressures or velocity spikes several streets away. On an active distribution network, discovering those unintended hydraulic consequences in real time leads to customer complaints and emergency calls.

Operational modeling allows control room operators and system engineers to simulate field actions beforehand. By observing system-wide head losses, tank turnover, and flow reversals in the software, you can verify operational strategies and test contingencies before mobilizing field personnel.

Model operational changes in minutes

Configure operational scenarios quickly by adjusting the physical parameters and automated logic that govern daily system behavior:

  • Adjust set points on control valves (PRVs, PSVs, FCVs), and open, close, or throttle isolation valves (TCVs).
  • Set pump status, speed settings, and variable speed pump (VSP) targets.
  • Set tank operating ranges and simulate localized emergency demand surges.
  • Update control rules that govern asset triggers based on system pressures, tank levels, or time of day.
  • Take mains out of service to evaluate shutdown plans and temporary bypass routes.
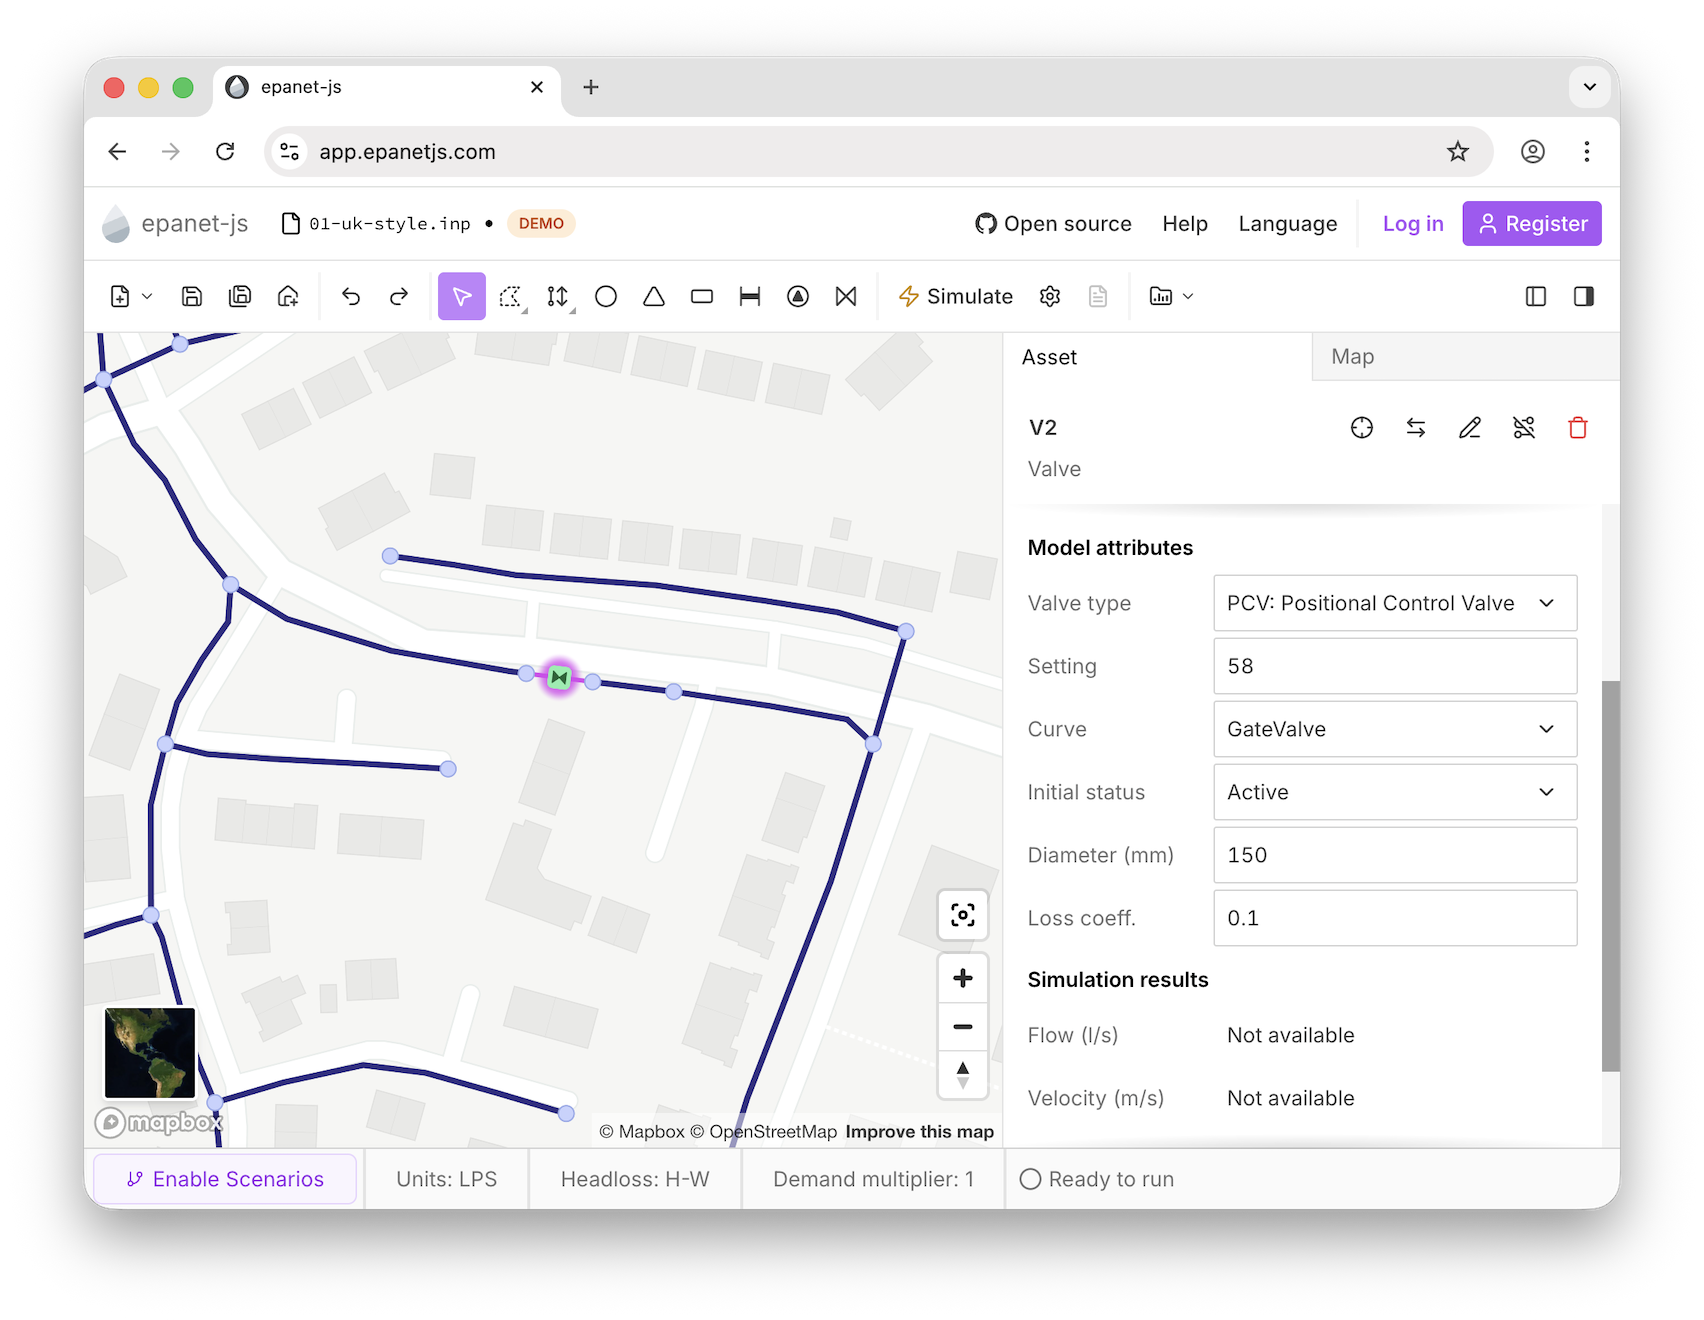
Adjusting pressure reducing valve settings and control criteria in epanet-js.

Simulate system-wide dynamic response

Run extended period simulations (EPS) and track pressures, flow directions, and velocities across the distribution system. Dynamic color ramps highlight head loss variations, making secondary impacts obvious immediately.

For outage analysis, epanet-js supports Pressure-Dependent Demand (PDD). Unlike traditional demand-driven calculations that assume full outflow regardless of pressure, PDD models outflow as a function of available pressure head. This gives an accurate, physical representation of customer deficits and supply boundaries during low-pressure events.

Compare alternatives against a fixed baseline

Selecting the safest operational strategy requires direct comparison. Set up competing options as distinct scenarios branching from the same calibrated baseline network, simulate them, and view differential head and flow results side by side.

Because each branch references the same underlying network geometry and base demands, observed variations reflect only your operational changes—preventing unintentional model drift from confounding the evaluation.

Plan shutdowns before the crew rolls

Planning a water main isolation requires answering two immediate questions: which isolation valves must close to isolate the segment, and which customers will experience a loss of service. By closing valves in an operational scenario, epanet-js calculates the isolated footprint and highlights peripheral areas at risk of pressure drops.

If the isolation causes service failures in adjacent pockets, you can test a temporary backfeed, mobile supply, or open an existing boundary valve in the same scenario until pressures stabilize. Field crews arrive with an accurate valve list, and customer notification lists can be generated before work begins.

Explore valve criticality

Optimize pumping schedules against energy tariffs

Pumping energy represents one of the largest controllable operational expenses for water utilities. Map pump operating hours against time-of-use power tariffs, shifting high-lift pumping to off-peak periods while confirming that service reservoirs maintain adequate storage buffers for peak consumption.

You can also test automated control rules before reprogramming SCADA controllers. Adjust level thresholds for tank-triggered starts and stops, simulate 24- to 72-hour cycles, and verify that pump cycle counts remain within mechanical tolerances.

Maintain an auditable record of operational decisions

Operational choices often undergo technical reviews months after implementation. Managing interventions through structured scenarios ensures that every parameter change, baseline assumption, and hydraulic outcome is logged and easily reproducible.

If an operational test demonstrates a permanent efficiency gain—such as an optimized PRV pressure setting or revised DMA boundary—the change set can be merged back into the master baseline model while archiving the investigation history.

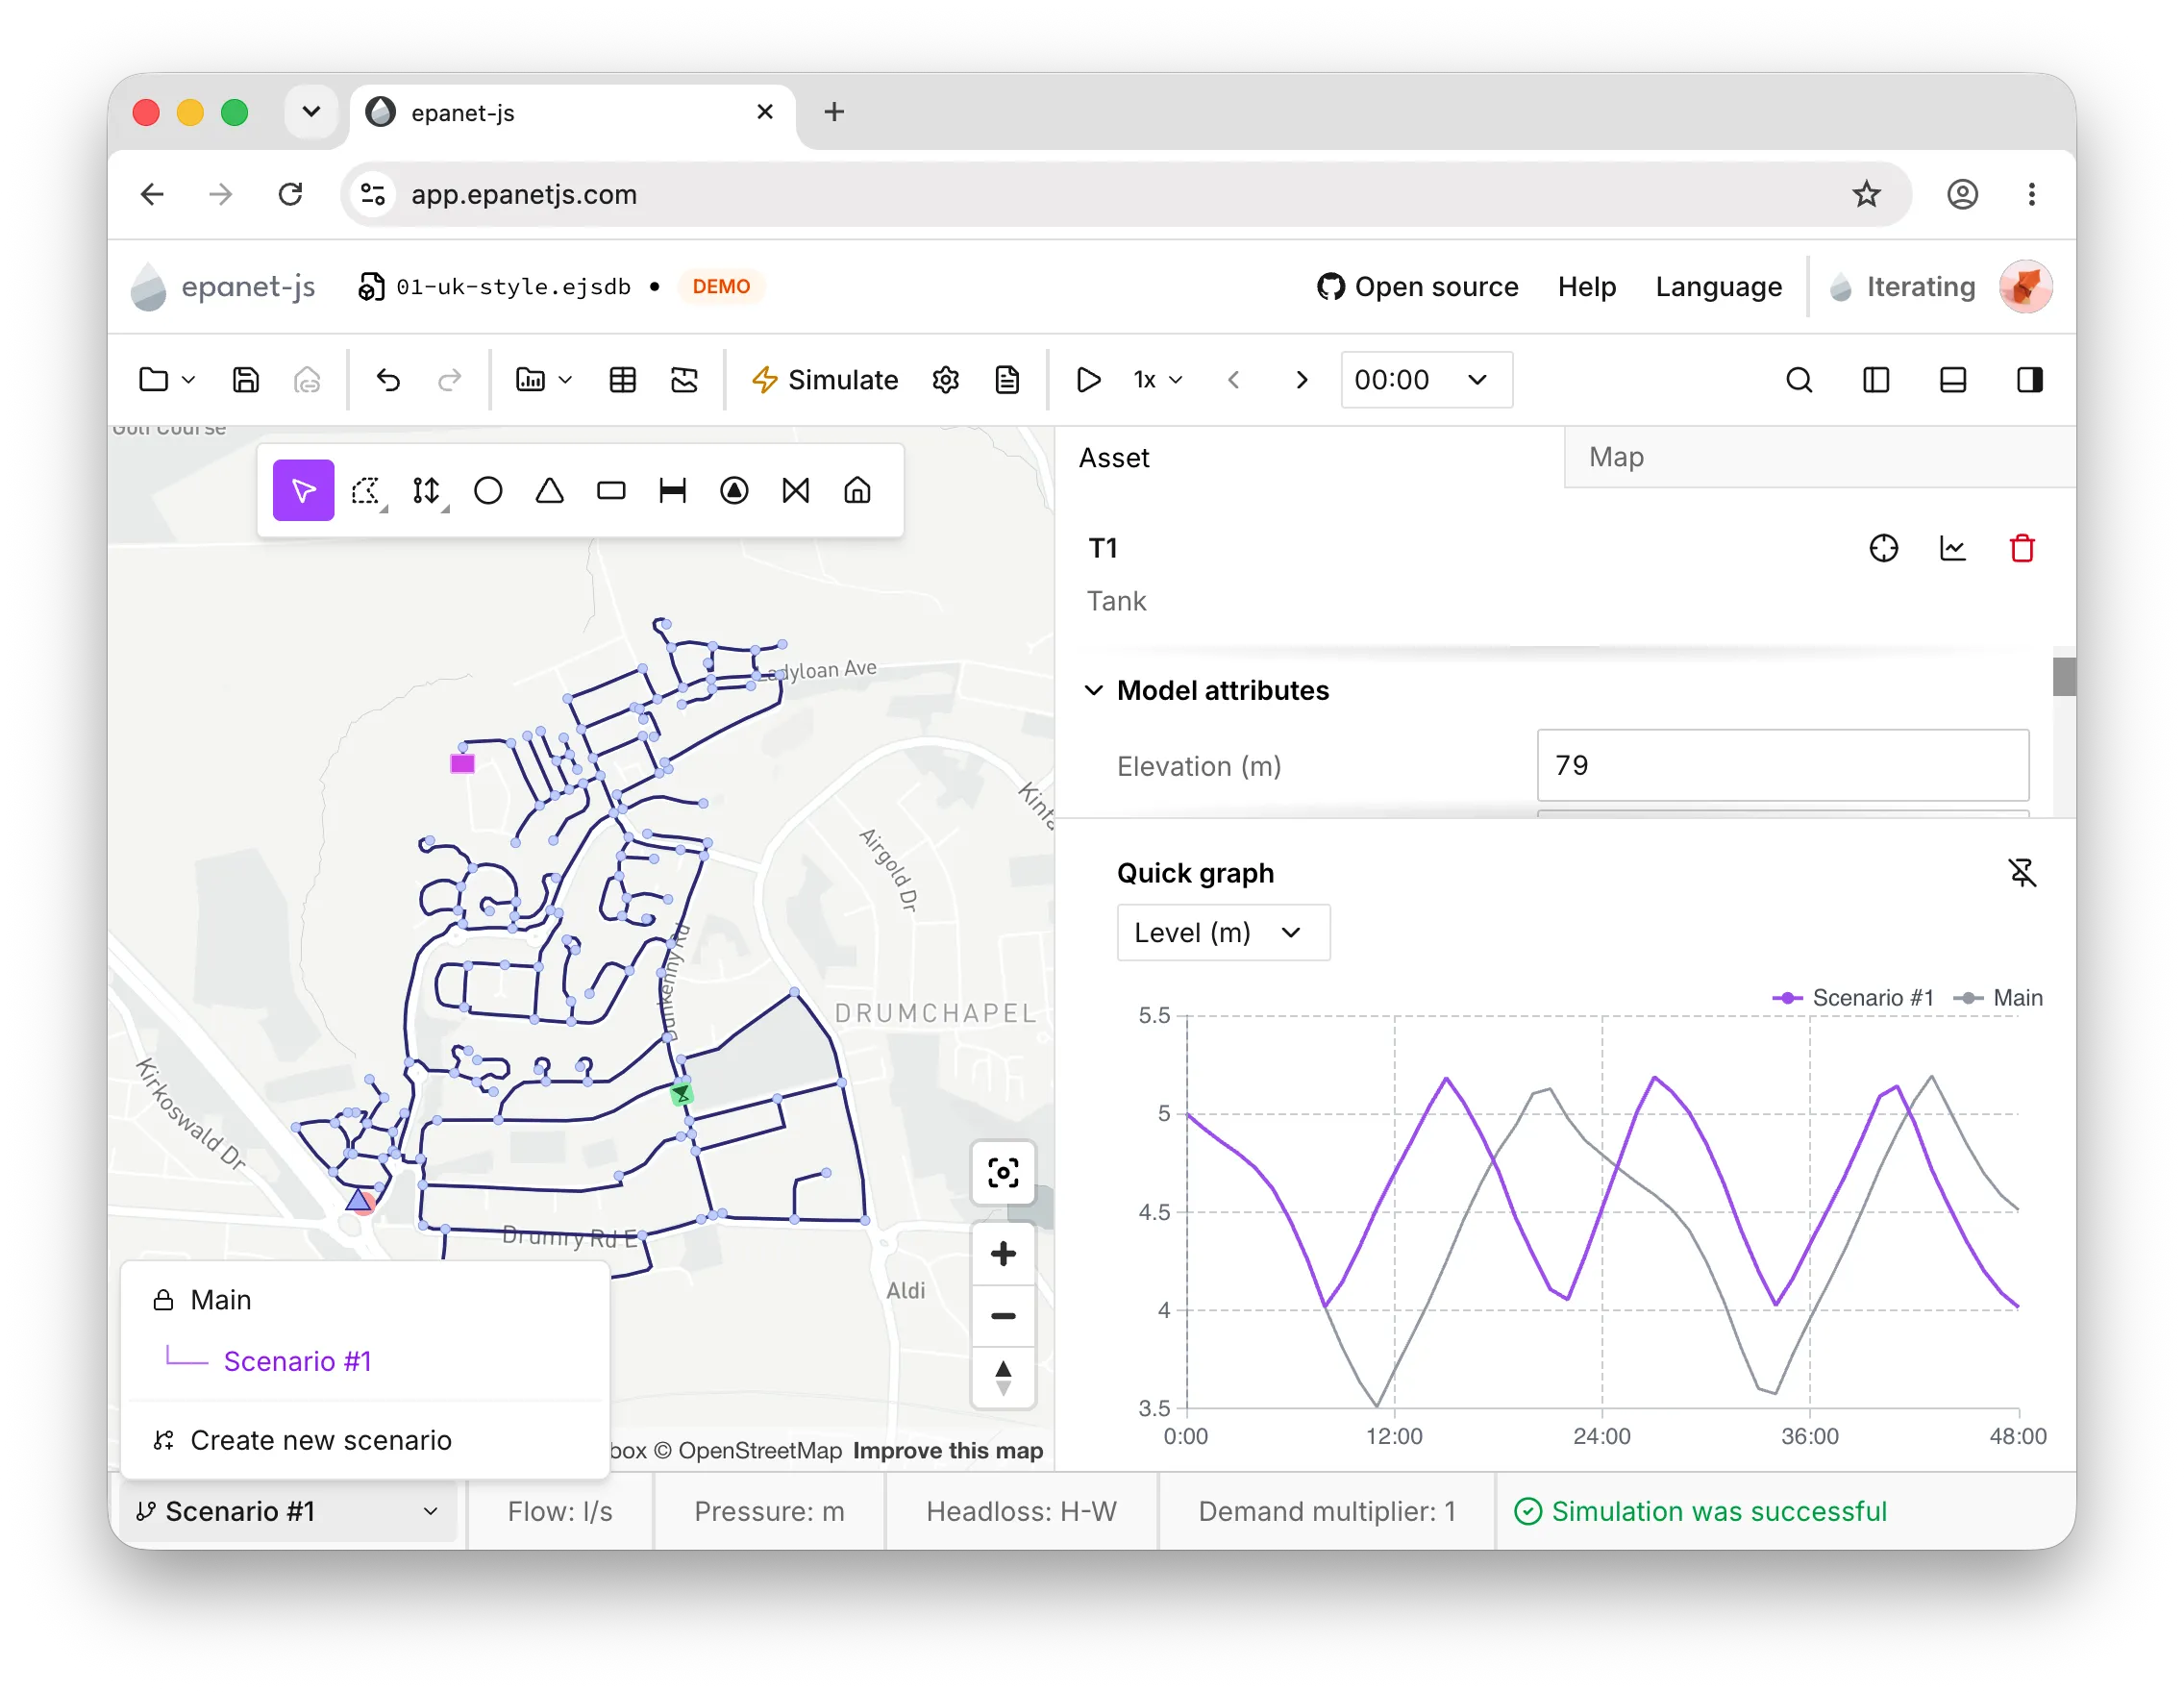
Comparative scenario analysis in epanet-js showing pressure differentials between operational configurations.

Core capabilities of operational modeling

Mitigate operational risk

Simulate valve closures, pump schedules, and rezoning schemes in the model before crews operate physical assets in the field.

Side-by-side scenario testing

Compare competing valve settings, pump operating schedules, and emergency backfeeds against a common baseline to keep pressures within range.

Streamline planned shutdowns

Identify isolation valves, quantify customer impact, and evaluate temporary backfeeds well before field crews mobilize.

Auditable decision history

Every scenario preserves its specific parameter deltas and operational logic, providing a transparent record for incident reviews and operations handoffs.

Test operations before taking field action

Simulate system responses to valve shutdowns, pumping changes, and rezoning configurations in a responsive, browser-based environment.

Routine operational challenges solved

Operational modeling delivers rapid answers to daily field inquiries: evaluating burst isolation sequences, assessing customer pressure impacts during valve maintenance, designing temporary bypass feeds during capital repairs, reviewing development capacity queries, or adjusting seasonal pressure regimes to mitigate leakage. Every scenario can be evaluated in minutes using verifiable hydraulic data.

Explore related solutions

See how operational modeling connects to the broader platform.

Frequently asked questions

Frequently asked questions about operational modeling in epanet-js.

What operational adjustments can be evaluated in epanet-js?
You can simulate valve operations (adjusting PRV, PSV, or FCV set points, and isolating lines with TCVs), pump operating schedules and speed settings, storage tank operating bands, localized demand fluctuations, and asset isolations for maintenance shutdowns or temporary bypass routing.
How do scenario comparisons work?
Scenarios branch from a verified baseline network. Rather than duplicating the entire model file, epanet-js tracks only the operational modifications (such as closed isolation valves or altered pump speeds). Running side-by-side comparisons displays differential pressure and flow heatmaps directly on the network map.
Why use pressure-dependent demand (PDD) for operational studies?
Standard demand-driven analysis (DDA) assumes customers receive 100% of their required consumption regardless of line pressure—even under zero or negative heads. PDD models the physical reality: as pressure drops during a shutdown or burst, delivered flow reduces accordingly. This gives an accurate assessment of actual customer outages and residual service levels.
How does epanet-js preserve historical operational records?
Because modifications are stored as discrete scenario layers rather than overwriting baseline files, you can reopen historical scenarios months later to inspect the exact assumptions, control settings, and hydraulic results that justified an operational decision.
How is this superior to duplicating .inp files?
Manually copying .inp files leads to version sprawl and untracked edits. In epanet-js, scenarios inherit from a single baseline. If you update pipe roughness or demand figures in the master model, all operational scenarios reflect that update automatically while preserving their specific operational changes. Read our scenarios architecture RFC for details.
How does operational modeling differ from capital planning?
Operational modeling focuses on immediate and short-term hydraulic responses—typically running extended period simulations (EPS) over 24 to 168 hours to evaluate valve statuses, pump controls, and emergency shutdowns. Long-term capital planning stages multi-year asset expansions and growth horizons across 5- to 20-year cycles. See planning for multi-year workflows.

Act with confidence, not guesswork

See how the network responds before you make the call. Launch epanet-js free, or book a demo to walk through it with us.